CONTENTS OF THIS FILE
---------------------
* Introduction
* Installation
INTRODUCTION
------------
Current Maintainer: Long Nguyen
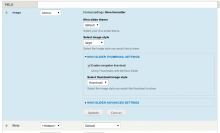
Nivo formatter is an image field formatter that transform any image field
to awesome Nivo Slider image gallery.
For user:
- Support image style.
- Support thumbnail.
- Support most settings of Nivo Slider, except advanced triggers callback
settings.
For developer, themer: nivo_formatter support to load your Nivo Slider theme. just drop it
in nivo-slider/themes/your-themes/ and ensure your stylesheet is
nivo-slider/themes/your-theme/your-theme.css
Currently, it is not working with Views, you may want to check this out module
Views Nivo Slider
It's working in views but you need to check the option for using field template file.
Please fix my typos if it's wrong! Thanks.
INSTALLATION
------------
1. Download & install libraries module.
2. Download & install jquery_update module.
3. Create directory sites/all/libraries.
4. Download Nivo slider and extract
to sites/all/libraries/nivo-slider.
Ensure this path exists:
sites/all/libraries/nivo-slider/jquery.nivo.slider.pack.js