Still on Drupal 7? Security support for Drupal 7 ended on 5 January 2025. Please visit our Drupal 7 End of Life resources page to review all of your options.
A module to control when the teaser Read More link appears in Drupal 7.
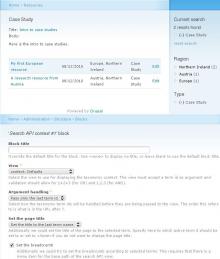
There is no mechanism in core to decide if the read more link should appear. This means that this link will always show no matter if there is additional content to display. This module tries to overcome this issue by allowing administrators to determine how to handle this link in relation to both the content type and individual fields.
The module allows you to add Read more links to other supported view modes (RSS feed, Search results, etc) or even other supported entity types. Particularly useful if you use panels or views and either programmatically add additional view modes or use other contrib modules to provide these.
With this module you can create PDF invoices for Ubercart orders. This module based on the Views PDF project.
The PDF invoice can be fully customized through admin interface. In combination with the Ubercart rules integration and the mimemail integration of the Views PDF you can send the Invoice directly to the customer per e-mail.
This is a simple feature for Open Atrium that implements the greasemonkey script from Nodeone that adds notes from an external site right onto the projects here at Drupal.org.