Still on Drupal 7? Security support for Drupal 7 ended on 5 January 2025. Please visit our Drupal 7 End of Life resources page to review all of your options.
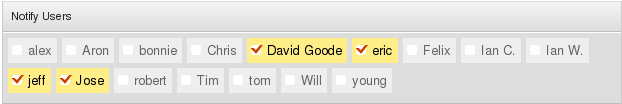
Subscribe other people on your team to posts and comments as you are writing. This module provides a nice user interface to create subscriptions on the fly for other site users.
Note that by using this feature, users can create subscriptions for other users, so this is mainly intended for small teams on which trusted users can decide which other members of the team should receive notifications about a post or follow up comments.
It can work with Organic Groups when enabled, restricting the selection to other members of the active group, or function independently, allowing the subscription of all other site members.
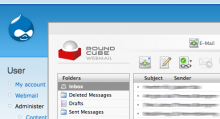
Integrates RoundCube Webmail with Drupal by automagically logging users in and out of RoundCube. It provides users with easy access to to their webmail, with support for Thickbox. See the module's documentation for details and instructions.