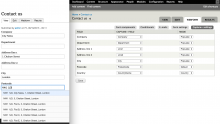
Use a third-party CSS or JS Framework, a self-hosted service like a CRM, or a third-party service with the site.
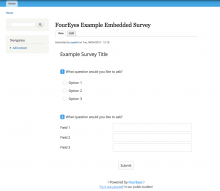
The FourEyes Module makes it quick and easy to embed surveys onto your Drupal articles or pages using shortcodes.
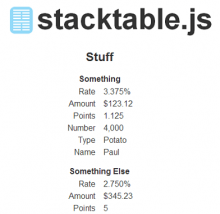
This module provides integration for the Stacktable.js plugin for creating responsive tables. The purpose of Stacktable.js is to give you an easy way
Mailgun module provides integration with the Mailgun email service.
Tracking YouTube Player Events with Google Analytics.
Usage: