Still on Drupal 7? Security support for Drupal 7 ended on 5 January 2025. Please visit our Drupal 7 End of Life resources page to review all of your options.
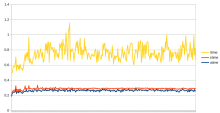
Adds to HTTP headers of a response the performance data of the request not only
as the actual execution time in seconds (rtime), but also the utime and stime:
rtime represents the total duration of the response generation process.
utime represents the actual CPU time, exclusively spent on processing only
the PHP code of the current request, excluding other background processes.
stime represents the CPU time spent on kernel processes like disk read/writes
and other IO operations.