Module Description
The Taxnomy Pivot module generates a pivot-style Table with vocabularies as dimensions on the axes. As values in the cells of the table it shows the number of nodes attached to the terms of the vocabulary.
Example:
The nodes in the system are classified by the vocabularies Voc1 (with Terms a,b,c) and Voc2 (with Terms x,y,z). If Voc1 is chosen for the x-Axis and Voc2 is chosen for the y-Axis the resulting table will look like this:
      a     b     c
x    1     5    13
y    0     4      3
z    4     5     6
In this example there is 1 node classified with a & y and there are 6 nodes with c & z.
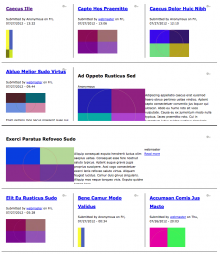
Another more demonstrative example of a car resale site:
Each node is a car and the dimension describe different properties of the cars.
Dim1: Transmission (Vocabulary): Automatic,  Manual (Terms)
Dim2: Color: Red, Blue, Yellow
Dim3: Model: Ford, VW, BWM, Mercedes
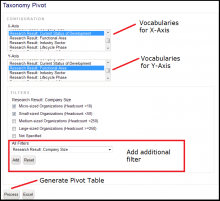
In the pivot table now filters and the values for axis can be defined. For the filter the "model" (or multiple dimensions) could be set and the terms VW and BMW are selected. On the x-axis is the color and on the y-axis the type of transmission. Each axis can have 0, 1 or multiple taxonomies assigned. The described setup results in the following pivot table:
Model: VW, BMW
           Red Blue Yellow
Automatic   5   7     3
Manual      2   3     1
Which means there are 5 cars of red color with an automatic transmission of the models VW and BMW.
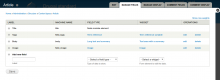
Further options are the presentation of this table as a chart, the export to Excel or displaying the nodes "behind" the values. A click on the "5" would load a list of the 5 node titles and link to the contents.
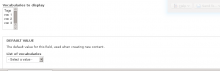
In contrast to a view not only the output as a pivot table differs, but also the configuration of filters. Not only the filter values (terms) can be selected by the user, but also the configuration of the filters (vocabularies) is made available to the user.
 DDEV is the official local development tool of Drupal. And like Drupal, DDEV depends on the support of the open source community.