
Problem/Motivation
After an upgrade to 10.1.x, a request to any non-existent theme asset will trigger an Exception with a 400 error.
Symfony\Component\HttpKernel\Exception\BadRequestHttpException: The theme must be passed as a query argument in Drupal\system\Controller\AssetControllerBase->deliver() (line 127 of /home/slwa/public_html/slwa.wa.gov.au/public_html/web/core/modules/system/src/Controller/AssetControllerBase.php).
Both for anonymous and authenticated users. Sometimes a referrer value is listed. The location value is a compiled JS or CSS file.
A stackoverflow thread for the same issue: https://stackoverflow.com/questions/76665253/random-symphony-exception-d...
Steps to reproduce
1. Install a generic Drupal 10.1.x site.
2. Navigate to a non-existent theme asset, such as /sites/default/files/js/foo.js
3. An Exception is triggered and populated in the logs.
Steps to reproduce
This appears to be due to stale HTML in varnish, or possibly reverse proxies implemented by mobile providers. Exact sources of the traffic haven't been pinned down though.
Proposed resolution
Lower the log level to 'warning' since it is a client, not application, error.
| Comment | File | Size | Author |
|---|---|---|---|
| #56 | Screenshot 2023-11-11 103853.jpg | 187.75 KB | TrevorBradley |
Issue fork drupal-3377310
 Show commands
Start within a Git clone of the project using the version control instructions.
Or, if you do not have SSH keys set up on git.drupalcode.org:


Comments
Comment #2
rsslwa CreditAttribution: rsslwa commentedFurther testing rules out our WAF. The same error occurs for requests that bypass the WAF.
Comment #3
cilefen CreditAttribution: cilefen as a volunteer commentedSome people on that site don’t know that https://drupal.stackexchange.com/ exists.
Anyway, bug reports here need steps to reproduce and you could get a stack trace. Drupal 10.1 does change how assets are built and there have been a handful of bugs reported to date.
Comment #4
cilefen CreditAttribution: cilefen as a volunteer commentedThat information needs to be here, in this bug report.
Comment #5
MWaters CreditAttribution: MWaters commentedI was (and still am) seeing the same exception here. In the logs I can see the request for the page source, followed by the new style css and js requests but sometimes what looks like an old css/js request. The frequency of these is much less now a few days after the upgrade to 10.1.1 so I can only imagine some browsers are requesting components of a previous cached page while they wait for the main page to be returned to them. It's not something I can repeat, as it only happens in production.
Comment #6
cilefen CreditAttribution: cilefen as a volunteer commentedThat is interesting. What path on the site are these GET requests to as compared to that of a working request?
Comment #7
MWaters CreditAttribution: MWaters commentedJust the same, they just miss out the query string. Here's the log for a single request in case you're keen to wade through it. I changed the domain name to protect the innocent!
172.31.46.237 - - [31/Jul/2023:18:42:24 +0000] subdomain.example.com "GET /user/1014 HTTP/1.1" 403 12626 "-" "Mozilla/5.0 (iPhone; CPU iPhone OS 16_5_1 like Mac OS X) AppleWebKit/605.1.15 (KHTML, like Gecko) Version/16.5.2 Mobile/15E148 Safari/604.1"
172.31.46.237 - - [31/Jul/2023:18:42:25 +0000] subdomain.example.com "GET /sites/club0011/files/css/css_36uDh63LXSs76qjstCdFOLgR2cDdda9r1WTbq74NrgY.css?delta=0&language=en&theme=cth&include=eJxtjF0OAiEMhC-Ey5FMwUpwC12Z7kM9vUYSsxrf5u8bOIxbTAQOiYbVNWYhwJc_UWOACiNkHRy7jkZSH59VEU0kJ5hL7SVckX6jN3e77zw8cKMqZ9FSe9xe9yv7dF_NQU9ae-apLmPfSBYYGeMJWJpNaQ HTTP/1.1" 200 2749 "https://subdomain.example.com/user/1014" "Mozilla/5.0 (iPhone; CPU iPhone OS 16_5_1 like Mac OS X) AppleWebKit/605.1.15 (KHTML, like Gecko) Version/16.5.2 Mobile/15E148 Safari/604.1"
172.31.46.237 - - [31/Jul/2023:18:42:25 +0000] subdomain.example.com "GET /sites/club0011/files/css/css_PH43SPObUN9UfC17NeGNJqkiZ-B83AlfyqKYZ7_oWHU.css?delta=1&language=en&theme=cth&include=eJxtjF0OAiEMhC-Ey5FMwUpwC12Z7kM9vUYSsxrf5u8bOIxbTAQOiYbVNWYhwJc_UWOACiNkHRy7jkZSH59VEU0kJ5hL7SVckX6jN3e77zw8cKMqZ9FSe9xe9yv7dF_NQU9ae-apLmPfSBYYGeMJWJpNaQ HTTP/1.1" 200 11155 "https://subdomain.example.com/user/1014" "Mozilla/5.0 (iPhone; CPU iPhone OS 16_5_1 like Mac OS X) AppleWebKit/605.1.15 (KHTML, like Gecko) Version/16.5.2 Mobile/15E148 Safari/604.1"
172.31.46.237 - - [31/Jul/2023:18:42:25 +0000] subdomain.example.com "GET /sites/club0011/files/js/js_XGNd8E2XD6K7ln4v0LLI9waimR0qOsMKNkaN76hul4U.js?scope=footer&delta=0&language=en&theme=cth&include=eJxtjF0OAiEMhC-Ey5FMwUpwC12Z7kM9vUYSsxrf5u8bOIxbTAQOiYbVNWYhwJc_UWOACiNkHRy7jkZSH59VEU0kJ5hL7SVckX6jN3e77zw8cKMqZ9FSe9xe9yv7dF_NQU9ae-apLmPfSBYYGeMJWJpNaQ HTTP/1.1" 200 36044 "https://subdomain.example.com/user/1014" "Mozilla/5.0 (iPhone; CPU iPhone OS 16_5_1 like Mac OS X) AppleWebKit/605.1.15 (KHTML, like Gecko) Version/16.5.2 Mobile/15E148 Safari/604.1"
172.31.46.237 - - [31/Jul/2023:18:42:25 +0000] subdomain.example.com "GET /sites/club0011/files/logo/KFC_Web_Logo.svg HTTP/1.1" 200 13995 "https://subdomain.example.com/user/1014" "Mozilla/5.0 (iPhone; CPU iPhone OS 16_5_1 like Mac OS X) AppleWebKit/605.1.15 (KHTML, like Gecko) Version/16.5.2 Mobile/15E148 Safari/604.1"
172.31.46.237 - - [31/Jul/2023:18:42:24 +0000] subdomain.example.com "GET /sites/club0011/files/css/css_5QIOX67YRJAVVb0EhhnXHbGkIS4M8revWNGPGM1rids.css HTTP/1.1" 400 4997 "https://subdomain.example.com/user/1014" "Mozilla/5.0 (iPhone; CPU iPhone OS 16_5_1 like Mac OS X) AppleWebKit/605.1.15 (KHTML, like Gecko) Version/16.5.2 Mobile/15E148 Safari/604.1"
172.31.46.237 - - [31/Jul/2023:18:42:24 +0000] subdomain.example.com "GET /sites/club0011/files/js/js_C_2va83ewPZSp_sGEiXTLudga5173S7_hKEJtPpqB4Y.js HTTP/1.1" 400 4997 "https://subdomain.example.com/user/1014" "Mozilla/5.0 (iPhone; CPU iPhone OS 16_5_1 like Mac OS X) AppleWebKit/605.1.15 (KHTML, like Gecko) Version/16.5.2 Mobile/15E148 Safari/604.1"
172.31.46.237 - - [31/Jul/2023:18:42:24 +0000] subdomain.example.com "GET /sites/club0011/files/css/css_xvEIUbbpPM0ngBjJCt3buIm8uZzMRpvEAwKAX6SkD2s.css HTTP/1.1" 400 4997 "https://subdomain.example.com/user/1014" "Mozilla/5.0 (iPhone; CPU iPhone OS 16_5_1 like Mac OS X) AppleWebKit/605.1.15 (KHTML, like Gecko) Version/16.5.2 Mobile/15E148 Safari/604.1"
172.31.46.237 - - [31/Jul/2023:18:42:25 +0000] subdomain.example.com "GET /sites/club0011/files/css/css_xdlm4DznKZNjS6A9t3mq3gFwWz3Ip0uxuP4BZerMd9A.css?delta=2&language=en&theme=cth&include=eJxtjF0OAiEMhC-Ey5FMwUpwC12Z7kM9vUYSsxrf5u8bOIxbTAQOiYbVNWYhwJc_UWOACiNkHRy7jkZSH59VEU0kJ5hL7SVckX6jN3e77zw8cKMqZ9FSe9xe9yv7dF_NQU9ae-apLmPfSBYYGeMJWJpNaQ HTTP/1.1" 200 334 "https://subdomain.example.com/user/1014" "Mozilla/5.0 (iPhone; CPU iPhone OS 16_5_1 like Mac OS X) AppleWebKit/605.1.15 (KHTML, like Gecko) Version/16.5.2 Mobile/15E148 Safari/604.1"
I noticed the timestamps are a bit wonky, is this a clue? The first request is for the page source and it results in a 403 Access Denied. At the same time there are three requests to invalid css and js files which all result in the 400 status code. But note there are valid requests as well, a second later (although I only have resolution to the second in the log file). I don't have evidence but I bet the source for the page only contains the valid references with the query strings. But then why would the browser request the invalid ones? It's a bit of a mystery to me.
Comment #8
cilefen CreditAttribution: cilefen as a volunteer commentedQuery argument "theme" being required is an intentional outcome of #1014086-369: Stampedes and cold cache performance issues with css/js aggregation however I guess that cached pages referencing the old asset paths is collateral damage.
There has been a series of followup issues resulting from the asset system changes in 10.1.0. This may in fact be a new one.
Comment #9
longwaveDo you have a CDN or Varnish or anything else in front that could be altering the requests? The private IP in the logs suggests at least some kind of reverse proxy setup; if you had true IPs then that might give you more clues as to whether it is the same clients making the bad requests.
Comment #10
MWaters CreditAttribution: MWaters commentedHi longwave, there's no CDN but web servers are behind a load balancer and WAF. The WAF doesn't change the requests, it just passes on requests it thinks are okay.
In the last sample, I'm almost 100% certain this is from one client, it's a low traffic site and there's a single burst of activity at that time. The IP is just the load balancer, the actual public IP isn't logged.
It might be useful to log the actual page source returned for a while on that site, and I'll have a look to see if it's always a 403 status that these have in common. Job for tomorrow though.
Comment #11
MWaters CreditAttribution: MWaters commentedI have collected some more information. The exceptions have Agent strings below:
Mozilla/5.0 (Macintosh; Intel Mac OS X 10_15_6) AppleWebKit/605.1.15 (KHTML, like Gecko) Version/15.6.6 Safari/605.1.15
Mozilla/5.0 (iPhone; CPU iPhone OS 16_0 like Mac OS X) AppleWebKit/605.1.15 (KHTML, like Gecko) Version/16.0 Mobile/15E148 Safari/604.1
Mozilla/5.0 (Macintosh; Intel Mac OS X 10_15_7) AppleWebKit/605.1.15 (KHTML, like Gecko) Version/16.3 Safari/605.1.15
Mozilla/5.0 (iPhone; CPU iPhone OS 16_0 like Mac OS X) AppleWebKit/605.1.15 (KHTML, like Gecko) Version/16.0 Mobile/15E148 Safari/604.1
Mozilla/5.0 (Macintosh; Intel Mac OS X 10_15_7) AppleWebKit/605.1.15 (KHTML, like Gecko) Version/15.6.1 Safari/605.1.15
Mozilla/5.0 (iPhone; CPU iPhone OS 16_2 like Mac OS X) AppleWebKit/605.1.15 (KHTML, like Gecko) Version/16.2 Mobile/15E148 Safari/604.1
So all from Safari. Has anyone seen any other browser generate these? (I took the time of these errors and tracked them down in /var/log/httpd/access_log).
Comment #12
MWaters CreditAttribution: MWaters commentedI turned on mod_dumpio (for a while, it's easy to fill up a disk!), and I captured an example that includes the request for an old style css file.
The source page returned was also captured and there is no mention of the non-existent css, the page response looks as it should be. But the same socket connection used for the page source then goes on to request the css.
In the request for the css from Safari, this header caught my eye (domain changed):
I suspect this is something Safari is doing to speed up at the client; requesting cached CSS. But it does seem odd that it would request resources that aren't on the page source (anymore).
As to what we do about it in Drupal, I would support not logging this as an error and sending a 400 or 404 back to the browser.
Comment #13
rsslwa CreditAttribution: rsslwa commentedHi MWaters, I'm seeing the error in Chrome, haven't tested in Safari. Good to know the page source is unaffected. I'm just trying to find a stacktrace (I'm new to the Drupal environment).
Comment #14
catchThis sounds plausible. It could be doing something like caching the HTML (ignoring no cache headers) and requesting the assets from that at the same time it requests the actual page.
There's already an issue to stop logging 4xx errors at #2828706: ExceptionLoggingSubscriber should not log HTTP 4XX errors using PHP logger channel, I think this is probably a duplicate of that issue, but leaving open a bit longer in case any more information comes through about the source of the requests.
Comment #15
zieder CreditAttribution: zieder commentedI am also getting these errors. It is always asking for an optimized js file with name of the form js_IMkXudKT5kgd-1o8uvzIdNr2pGL1R7SUgrOOR_adVwo.js.
Aggregate CSS and JS files are disabled. I am not using AdvAgg. I do not have default/files/js or css folders. Caches have been cleared many times. This has been occuring since upgrading to 10.1 and continues with 10.1.2.
WHY would the system think it needs an optimized js file when all those settings are turned off?
This seems completely random. Examining the apache log entries at the same time of the logged error does not reveal any pattern.
Comment #16
catch@zieder the controller for serving aggregated files is available whether or not aggregation is enabled, it would for example allow cached HTML pages to be served correctly if aggregation has just been turned off. This error doesn't mean that your site is serving pages with the wrong URL but that something somewhere is requesting the wrong URL - it could be cached pages or the safari issue mentioned above.
Marking this postponed on #2828706: ExceptionLoggingSubscriber should not log HTTP 4XX errors using PHP logger channel which is IMO the correct fix here.
Comment #17
Janner CreditAttribution: Janner commentedI'm experiencing this too after upgrading from 9.5.10 to 10.1.2 a couple of days ago.
For those of you who have been experiencing this longer and observed a decline in the frequency, did this pattern continue? Have the entries gone away completely yet?
Thanks!
Comment #18
Janner CreditAttribution: Janner commentedTo answer my own question, it's now been 10 days since an upgrade introduced this issue on my site. There's been no noticeable drop-off in the frequency and number of these messages in this time.
Comment #19
rsslwa CreditAttribution: rsslwa commented@Janner - they have almost completely disappeared on the site I manage. Been about 1 moth I think.
Comment #20
Janner CreditAttribution: Janner commentedIt's now been more than a month since I first started seeing these error messages, and I'm still typically seeing in the region of 200 per day. This isn't on a particularly high traffic site.
This is far from ideal, as it makes it easy to overlook a PHP error that I might not want to overlook!
Comment #21
catch@Janner please review #2828706: ExceptionLoggingSubscriber should not log HTTP 4XX errors using PHP logger channel which is how this issue will get fixed.
Comment #22
mark_fullmerI've tested the latest patch in #2828706: ExceptionLoggingSubscriber should not log HTTP 4XX errors using PHP logger channel, and I do not believe that the approach taken there will fix the issue as it is framed here.
The title of this issue, "400 exceptions result from requests for old asset paths which are missing the "theme" query string," implies that the community thinks that the requests for old asset paths should not trigger a 400 error at all. The approach in the MR in #2828706: ExceptionLoggingSubscriber should not log HTTP 4XX errors using PHP logger channel will still populate an error message via an Exception, now under the category "client error" rather than PHP:
This issue doesn't yet seem to document the steps to reproduce this scenario, which for me appear to be straightforward and do not require an edge cache layer, as suggested above. Simply going to any vanilla Drupal 10.1.x site and navigating to a non-existent theme asset, such as
/sites/default/files/js/foo.jswill trigger this Exception.(Not my area of expertise: could this be a vector for a denial of service attack for a site that is carelessly using the database-based logging
service?)
I therefore think this issue might better be considered separate from #2828706: ExceptionLoggingSubscriber should not log HTTP 4XX errors using PHP logger channel. That issue makes sense on its own terms for categorizing Exceptions, but it does not address the issue here. In my opinion, the design of the business logic in
modules/system/src/Controller/AssetControllerBase.phpseems problematic. A request from anywhere, for a non-existent file, should throw an Exception? That doesn't seem right:The more intuitive HTTP response, to me, would be a 404.
I've attached a patch that would narrowly resolve this issue by throwing a 404 instead of a 400. I don't expect that this should be the final implementation, but for folks where the number of 400 errors showing in their logs is a problem, this could be a band-aid.
Comment #23
mark_fullmerComment #24
mark_fullmerComment #25
catchNot any more than 404s are.
Comment #26
mark_fullmerGood point. I was incorrectly assuming that the fast404 default setting would bypass 404s from paths like
/sites/default/files/js/random.js, but that's not part of the standarddefault.settings.php. Plus any other "valid" 404 would end up in the logs, too.More to the point: it would be helpful to resolving this issue to find clarity on what is core's reason that the response code for an invalid filename or invalid query parameter in the theme layer is set to be a 400, rather than a 404. I'll try to do some research into the issues that introduced this change to get clarity on that. Perhaps the 400 in this context is meant to indicate to a developer that an requested theme asset is not loading. If so, it has a maybe unforeseen side-effect that *any* invalid path to a theme asset will throw a 400.
Comment #27
catch@mark_fullmer I worked on the original issue which is here #1014086: Stampedes and cold cache performance issues with css/js aggregation.
The reason for a 400 is twofold:
1. We very carefully validate the URLs to avoid an actual denial of service issue - if we created aggregates on disk from invalid URLs, it could lead to disk filling. This doesn't affect 400 vs 403 really, but it's why the code exists at all.
2. If someone is trying to customize the aggregation logic (via replacing services etc.) and breaks the URL generation, it seems more helpful to provide a 400 than a 404. Sites get lots of 404s, and you could also get that if you put completely the wrong directory in, this at least tells you you're trying to do something that won't work.
It's not any invalid path to a theme asset, it's only invalid requests specifically to the folder where core writes aggregates to. Actual theme assets in the theme folder are unaffected by this, except that they'll usually be aggregated rather than served directly.
Comment #28
mark_fullmerThanks for the clarification, @catch. Based on the above, since core has rationale throwing a 400 for requests for old asset paths to the folder where core writes aggregates, then this issue could probably be closed as "works as designed."
Comment #29
catchThat's why I marked it #2828706: ExceptionLoggingSubscriber should not log HTTP 4XX errors using PHP logger channel but there do seems to be a fair number of relatively-unexplained log messages which is a bit unexpected - i.e. you'd assume that as soon as browsers, search engines etc. are getting the HTML, that the old aggregate paths wouldn't be requested.
Comment #30
capellicHello all,
We did our first Drupal 10 upgrade deploy last week (October 4) and noticed this error appearing. We have Sentry hooked up to this site so its pretty easy to see the frequency, user agent meta data and the stack trace. I see the user agent and stack tracking has been mentioned above, so I'll provide those details below.
We do have Cloudflare out in front of this site.
Number of errors per day
October 4: 13
October 5: 33
October 6: 44
October 7: 28
October 8: 19
October 9: 18
October 10: 27
October 11: 15
October 12: 14
Browser
Interesting that Chrome desktop or Safari doesn't appear at the top of this list. This site isn't "mobile-forward" so it does stand out to me that chrome mobile is representing 62% of the browser generating the errors.
Browser.name
Furthering my observation in "Browser" section above.
Client OS Name
Device Family
K? Huh? I can only assume that's shorthand for Android? Or is this bot traffic?
Stack trace
Comment #31
catch@capellic is cloudfare caching anonymous HTML requests?
General note that #2828706: ExceptionLoggingSubscriber should not log HTTP 4XX errors using PHP logger channel will be in the next patch release of Drupal 10.1 (beginning of December), so from then onwards these will still get logged, but not as PHP errors.
Comment #32
capellic@catch
We have a cache rule setup to bypass Cloudflare cache. Here's a screenshot of that cache rule: https://i.gyazo.com/5148b6705d55156ccd25d12d9d253717.png
Comment #33
joelpittet@catch Moving back to active because the problem persist. We've applied #2828706: ExceptionLoggingSubscriber should not log HTTP 4XX errors using PHP logger channel which only moves the error to a "client error" channel from a "php" channel. It's got the same severity of "error" and still litters our logs.
Clearing cache a bunch of times hasn't helped.
We are trying to reproduce the problem but without context around which theme or what asset, it's quite hard to find out how to solve this.
The similarity is this happens on various sites after upgrading from 9 to 10.1 as others have mentioned. And we were likely using advagg before, which we removed in the upgrade process.
Comment #34
joelpittet@catch I'm thinking this as others above have mentioned are cached results of aggregated assets that have been cleaned up, or some browser is stripping off the query strings OR both.
Maybe just return early on these bad requests and not log it?
Also, not a fix but downgrading these to a "warning" instead of "error" would help me in particular. Considering that is what we have for 404s and I filter those similarly in the logs.
Comment #35
catchI'd personally be quite happy with a follow-up to #2828706: ExceptionLoggingSubscriber should not log HTTP 4XX errors using PHP logger channel to set these as warnings instead of errors.
Silently failing I am less keen on because if someone is trying to generate these URLs (or working on the logic in core), then they'd get no feedback as to why something is wrong, but we just need something in the logs it doesn't have to be this obnoxious.
Comment #36
mark_fullmerWould logging them as 404s instead of 400s, as suggested in #22, meet this criteria?
Comment #37
catchThat feels semantically wrong because the path is found and the request is invalid, so would be better to try to lower log level for 400s first.
Comment #38
joelpittet@catch Would it be reasonable to add the patch here as that follow-up? I feel it has much of the context and the title still the same issue we are all solving. If you think a separate issue is easier path forward I'll do that.
Comment #39
catchYeah I think it's OK to lower the log level for 400s in this issue.
Comment #40
bkosborneChiming in to provide some additional data. We upgraded ~500 websites to Drupal 10.1 a week ago. We have a CDN in front of them, so I pulled some stats.
In a 24 hour period of all the requests for aggregated CSS files, just 0.07% of them did not include the query string parameter (these are the requests that logged the HTTP 400 error). We've also received zero reports of issues from this in the week since we've upgraded.
Here's some of my CDN's stats from these HTTP 400 requests. I assume it gets them from parsing the user agent and IPs:
Device types:
Browsers:
Operating systems:
Top user agents:
Additionally, the HTTP 400 errors are slightly trending down over the past week since the upgrade:

So, other than our watchdog logs filling up with these, it doesn't seem to be a serious problem for us.
Comment #41
capellicThanks @bkosborne, this is helpful.
Comment #43
joelpittetSetting to needs review for the MR !5159 to reduce the message to a warning from error.
Comment #44
eaajithe CreditAttribution: eaajithe commentedI had the same issue after migrating the site from 9.5.11 to 10.1.5. Finally found that the issue was with Varnish cache. I cleared it. Site came back to normal
Comment #45
smustgrave CreditAttribution: smustgrave at Mobomo commentedIf scope is changing to lower log level think issue summary should be updated.
Comment #46
pappisSame problem here. Just updated from 9.5.11 => 10.1.6
Cleared cache a bunch of times but it pops up in the logs quite frequently.
Comment #47
Willids CreditAttribution: Willids commentedI am getting these, cleared cache but still getting them
Symfony\Component\HttpKernel\Exception\BadRequestHttpException: The theme must be passed as a query argument in Drupal\system\Controller\AssetControllerBase->deliver() (line 132 of /home/DOMAINNAME/public_html/core/modules/system/src/Controller/AssetControllerBase.php).
Clean install and rebuild to latest drupal 10.1.6 with PHP 8.1
Comment #48
arefen CreditAttribution: arefen commentedI have the same problem with upgrading drupal 9.5.11 to 10.1.6
Comment #49
douggreen CreditAttribution: douggreen at Peak Digital, LLC commentedWe also are seeing this, a total of 8 sites, that we upgraded over a period of 2 weeks (didn't want to upgrade all at once).
On 10/11 we upgraded the first 5 sites
On 10/18 we upgrade the remaining 3 sites
On 10/31 I recorded 1867 errors in the prior week
On 11/7 I recorded 845 for the prior week
Has anyone considered using fallback defaults? For example, if 'theme' is not set as a query argument, use the default theme (taking into account if it's an admin path). If 'delta' is not set, use 0. etc...
Comment #50
catch@douggreen
There is fallback logic for when library definitions don't match - i.e. if a library definition is updated with a deployment, then old URLs for the old aggregate URL will still produce an aggregate, it just won't be written to disk any more.
However, these 400s only appear when the URL is from the old format entirely or completely invalid, it is probably from archived or cached HTML of the pre-10.1 version of the site somewhere, although that has not really been confirmed yet. GIven the old URLs didn't provide any metadata about what was in them at all, a fallback won't help IMO - you'd end up serving four CSS aggregates all with delta 0 or something.
I still think reducing the severity so that these are easier to ignore is the right approach here.
Comment #51
newswatch CreditAttribution: newswatch commented[Subscribing]
Comment #52
matt_paz CreditAttribution: matt_paz commentedWe observed similar issues. In addition to what others have done, I checked a healthy sample of the IPs. AFAICT, many were from bots like others observe. Several seemed to be from mobile ISPs. I saw others observe several mobile user agents were involved too. I wondered if some mobile ISPs are doing their own caching/reverse proxying in an attempt to improve perf in a way that might be contributing to this issue.
Comment #53
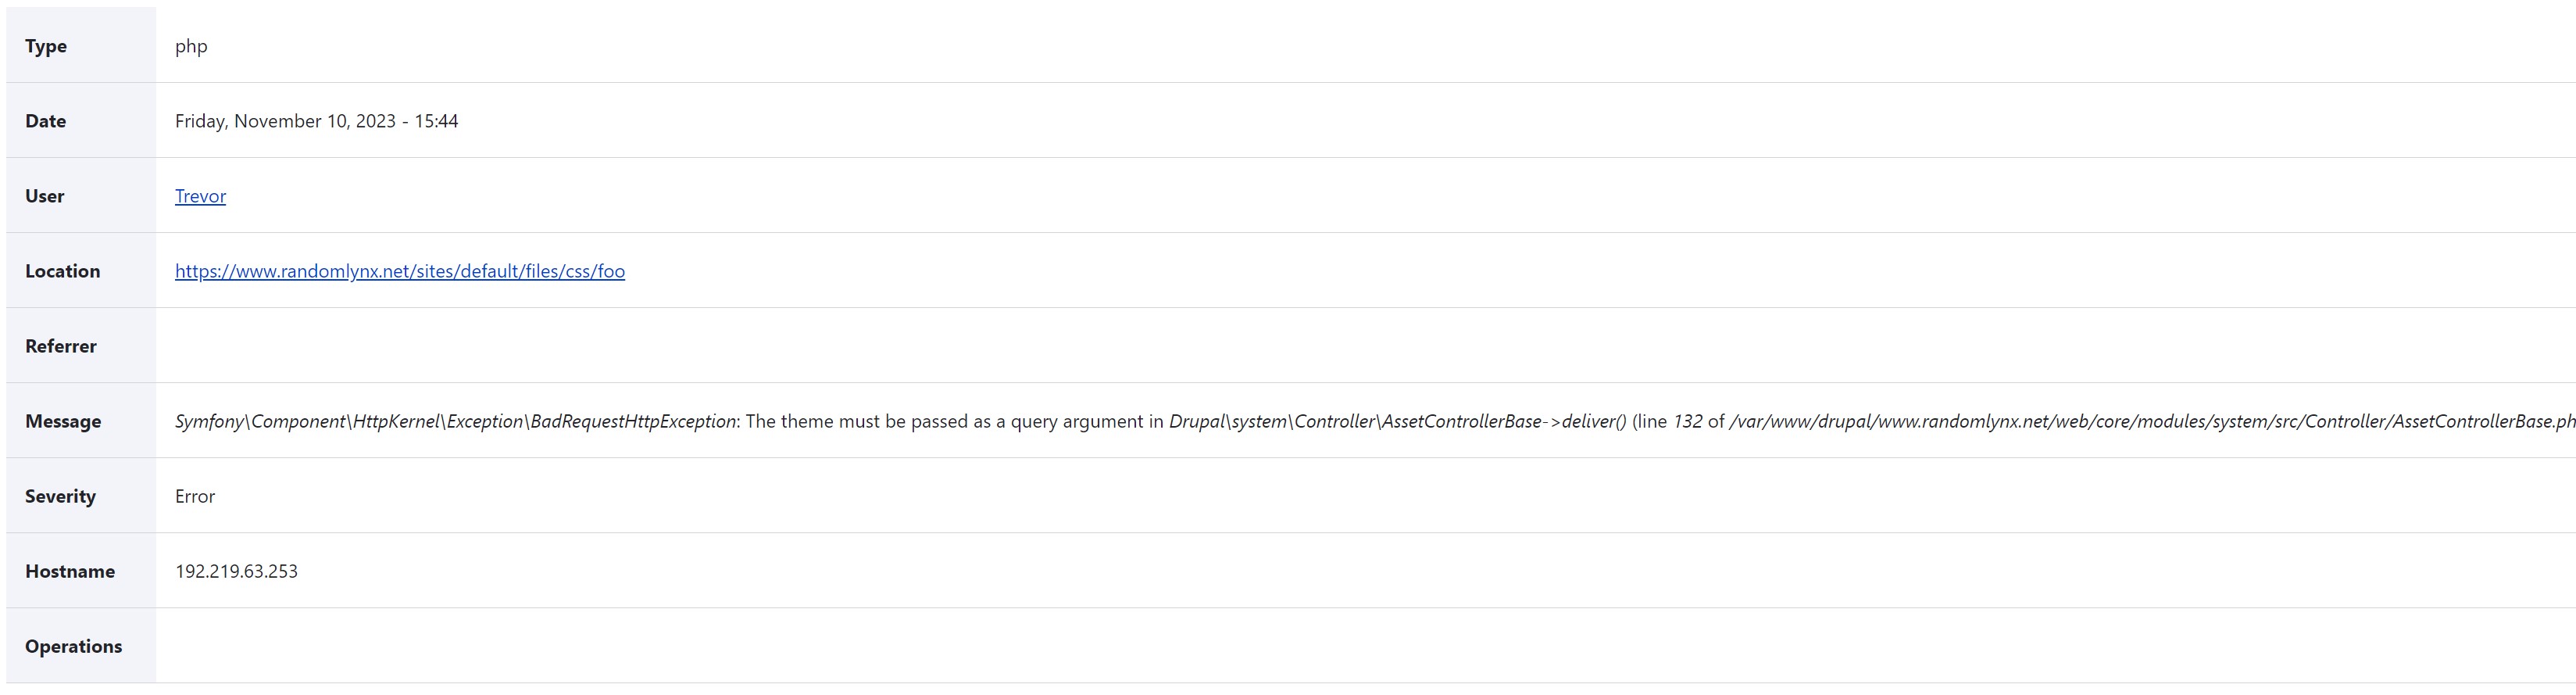
TrevorBradley CreditAttribution: TrevorBradley commentedJust a tiny bit more context - this also fires on any Drupal 10.1 site with any 404 in the /sites/default/files/css/ directory. e.g. /sites/default/files/css/foo
I noticed this while trying to use week old web logs to do load testing on a new server. The css files had become out of date and renamed on the new server. Every time I loaded an old missing css file, this php error would fire.
The argument here is that what is effectively a file not found warning should not throw a BadRequestHttpException and pollute the logs.
Comment #54
catchUpdated the issue summary. @TrevorBradley this isn't a PHP error, it's just a 400 instead of a 404. There's an existing MR in this issue it would be great if people could review and/or test. Doesn't make the issue go away, just makes it more equivalent to a 404 in the logs.
Comment #55
smustgrave CreditAttribution: smustgrave at Mobomo commentedIf lowering the status is what we are doing, could we add test coverage for it though?
Comment #56
TrevorBradley CreditAttribution: TrevorBradley commented@catch - to clarify, yes this isn't throwing a PHP error causing a WSOD. It is however adding an entry to watchdog, of type "php", with severity "Error".
Comment #58
catchPushed a new branch/MR targeting 11.x and with added test coverage.
Comment #59
smustgrave CreditAttribution: smustgrave at Mobomo commentedtest-only feature ran fine.
Think the new scope of this has been addressed, should a follow up be opened to address the issue?
Comment #60
catch@smustgrave I don't think so, it's by design, and we don't have any evidence it's being triggered from non-cached pages.
@TrevorBradley, are you running an up-to-date version of Drupal 10? #2828706: ExceptionLoggingSubscriber should not log HTTP 4XX errors using PHP logger channel was committed last month.
Comment #61
TrevorBradley CreditAttribution: TrevorBradley commented@catch - I was on Drupal 10.1.5. I just upgraded to 10.1.6 - No change - I still see BadRequestHttpException in the watchdog as a php log of type "Error". when attempting to access /web/sites/default/css/foo.
I tried this on a plain D10.1.6 site, and you're right, only a simple page not found error. This is something specific to my site I need to go investigate. Looks like something odd going on in my theme layer that just happens to throw the same error.
Carry on and ignore me for now. :D Thanks for the info.
Comment #62
arefen CreditAttribution: arefen commented@trevorBradly let us know if you find the source of the problem
I have the same issue and i can't find why i get this error
Comment #63
TrevorBradley CreditAttribution: TrevorBradley commented@arafen. Will do. If this ticket is closed by then I'll create a new ticket (But I'll reference it from here).
It's something to do with the theme not being defined in the request. I thought it might be bootstrap related, but when I went to set Claro as the default theme the problem persisted. It's... tricky. Might not be able to get to it for few days but I'll crack it.
Comment #64
kreatIL CreditAttribution: kreatIL commentedI get exactly this error as well since the update from Drupal 9.5 to 10.1. My website runs on a NGINX webserver under PHP 8.1. The frontend theme is Radix. I have already disabled the js and css aggregation and cleared caches a hundred times - without success. Also deleted all old js and css files inside sites/default/files. This error has been appearing in the log for weeks.
Comment #65
catch@kreatIL it's a client error, not a code error, it means you're getting requests for old css/js URLs. You can re-enable javascript and css aggregation and go on with your life. This issue will make it less noisy in the logs when it happens.
Comment #66
kreatIL CreditAttribution: kreatIL commented@catch: Thanks for the clarification. Although I would find it easier if such messages did not appear at all in the logs.
Comment #67
longwaveGiven that 403 and 404 are currently logged as warnings, I agree that other 4xx errors should also be demoted to warning. 5xx stays as error as proven by the new test coverage.
I tried to credit everyone who helped move the issue along with code, useful bug reports or investigations, or mentoring.
Committed and pushed 96695551d4 to 11.x and f6ea2f768d to 10.2.x and 25942e9c26 to 10.1.x. Thanks!
Comment #72
xamount CreditAttribution: xamount as a volunteer commentedFor anyone who got the error in the issue description, were you using the LiteSpeed Cache module for Drupal?
For me, I upgraded to D10, then some pages worked fine and some didn't. For the pages that didn't, the css/jss were not loaded and I saw the error in the Drupal logs (same error as this issue description).
After uninstalling the LiteSpeed Cache module, everything worked fine. Not sure if it's just me or what...
Comment #73
Janner CreditAttribution: Janner commented@xamount
I got the error but am not using the LiteSpeed Cache module.
Comment #74
pappis@xamount
Same.
I got the error but am not using the LiteSpeed Cache module.
Comment #75
Nelo_Drup CreditAttribution: Nelo_Drup commentedI have the same error and many logs are generated
Comment #76
jmohino CreditAttribution: jmohino commentedSince the update to Drupal 10.2 I have many logs with this same message although from what I have seen they all come from the same IP, which seems to be from GoogleBot.
Comment #77
johnrosswvsu CreditAttribution: johnrosswvsu at Promet Source commentedCan confirm that there is a lot of these in the server logs in Drupal 10.2.
Comment #78
jmohino CreditAttribution: jmohino commentedIn my case, after upgrading I did have many logs with this message, now they have been significantly reduced after 3 weeks
Comment #79
wmfinck CreditAttribution: wmfinck commentedUsing Cloudflare, this problem drove me nuts for days until I realized it was Cloudflare. The Cloudflare rule in #32 works for me, thank you!
I might experiment with more specific rules once the site goes into production.
Comment #80
mogio_hh CreditAttribution: mogio_hh commentedWe also got screenshots of the client showing that the site comes totally blank without any loaded assets (js and css) from now and then since this issue exists.
This error / log happens dozens of times daily sind the D10 Upgrade (latest 10.2)
Why is this bug marked as fixed? For me that would have been a stopper for the D10 Upgrade.
Comment #81
m.stentaI have installed a brand new site on 10.2 and this error just popped up in my logs, on a request to an aggregated JS file. I've also been seeing it on other instances that I upgraded from 7->9->10->10.2, but this was the first time I've seen it on a fresh 10.2 instance. So it may still be an issue... or something else is causing it too...
Comment #82
reloxo95 CreditAttribution: reloxo95 as a volunteer commentedI have updated my site from 9 to 10 (10.2) and I started to get lots and lots of new entrys on my logs with this error. I have to disabled all my minified modules and css/js agregation and I still receiving this error. It is fixed?, In what version? Any "quick" solution for this?
Thanks!
Comment #83
Nelo_Drup CreditAttribution: Nelo_Drup commented@reloxo95 If you updated from version 9, I recommend that you check if you have problems with path auto
Comment #84
sergeimalyshev CreditAttribution: sergeimalyshev as a volunteer commentedIn my case, these errors appeared after this patch for drupal/redirect.
https://www.drupal.org/project/redirect/issues/3373123#comment-15300077
So at the moment we just don’t apply it and everything is ok, but we had to turn off aggregation.
Comment #85
djdevinWe saw thousands of these after upgrading to D10, but they subsided after a while and are far less frequent now. (once a minute or so).
Guessing it's very old browser caches or bots. Would be nice if it wasn't in the logs though.
Comment #86
admirernepali CreditAttribution: admirernepali as a volunteer commentedIt's happening for us as well after upgrading to V10.2.5
Comment #87
cilefen CreditAttribution: cilefen as a volunteer commented#3393274: The theme must be passed as a query argument is for further work on other causes of this bug.