

Closed (fixed)
Project:
Forena Reports
Version:
7.x-4.2
Component:
Code
Priority:
Normal
Category:
Feature request
Assigned:
Unassigned
Reporter:
Created:
4 Oct 2014 at 01:16 UTC
Updated:
18 Jun 2015 at 13:04 UTC
Jump to comment: Most recent, Most recent file

Comments
Comment #1
metzlerd commentedGenerating a true combo graph is not possible via phpSVGGraph. You might be able to consider google charts implementation and using forena to get the data. If your permissions are set up to allow XML/Json consumption any data block can be set up to allow json access:
yoursite/forena/json/sampledb.states
That should serve as an example. I am not familiar enough with google charts yet to have figured out how that data might need to be transformed, to be passed to google charts, but it would seem possible to build your own javascript library to wrap/convert this data into a format that Google charts could provide.
Comment #2
metzlerd commentedI should have mentioned that the line fill is certainly possible, so if you are looking for help implementing that, it shouldn't be too hard.
Comment #3
MickC commentedThanks for responding - haven't taken it further yet as I'm not sure:
1. how to set up permissions to allow XML/Json consumption
2. how to use forena to get the data, but implement Google charts to display
If I can solve the first, it might get closer to the 2nd. Maybe the Google Chart Tools for Drupal module might be useful.
Another approach might be to complement Forena with the use of one of the Charts modules (Charts or Google Chart Tools), however as they use Views, I'd have to also use the Data module to get at my tables.
RE Line Fill - yes, that would be a good option, and give some 'combo' feel. I presume it's just frx options so will experiment.
Comment #4
metzlerd commentedUnder the forena section of the permissions tab you need to grant, "Access data from data blocks directly" to any users that you want to use the JSON service and then you can access data from any data block provided you have permissions to that data block. Report parameters get passed on the url per normal.
I can see doing this in a couple of different ways:
1. You write a js library to graph the data using graphs from the JSON data directly
2. You write a js library that scrapes data from the table and passes that to google charts.
I'm happy to consult as you need it. Good luck....
Comment #5
Pierre.Vriens commentedHm, this is evolving into another interesting discussion! Especially since I've also been looking into some of the modules mentioned in #3. Here are my thoughts / impressions about those modules:
So David, how about we try to push forena's limits even further to address Nick's (interesting) request ... Similar to what Allan Bean (one of the Apollo astronauts ... who probably has no relationship with the BEAN module ...) kept saying during some conference keynote I attended some years ago: there has to be a way to get it to work ..; While waiting Nick maybe want to consider a graph similar to figure 4 on http://www.goat1000.com/svggraph-dual-y-axis.php ? FYI: I discovered that graph today, I've added to my own list of R&D topics for forena) ...
PS: I'm thinking of creating a comparison of forena to various graphing/charting modules in Drupal that I'm aware of. This in the format of an extra community docu subpage. I've been looking around on D.O. already for such comparison, but I can't find anything on that. Makes sense? Is it worth creating a new forena issue about it, to be used also as a placeholder for any relevant comments / suggestions related to that topic (eg from Nick ...)?
Comment #6
Pierre.Vriens commentedI did some more research to further explore some of the options suggested in this issue. The summary of it is now included in Comparison with other charting solutions. Feel free to amend it, correct it, etc.
After digesting the summary, it appears to me that it would be a great (major?) forena enhancement if we come up with something like a "CGA renderer", as an alternative to the existing SVG Graph renderer. CGA being the abbreviation of Charts and Graphs API. The main difference between this CGA renderer and the SVG Graph renderer would be at the level of the calls to the Charts and Graphs module (instead of calling the SVG Graph library). Makes sense to create a new feature request issue for it, or should we consider it as an example of a custom renderer?
Comment #7
metzlerd commentedFeel free to file an issue request, but understand that I don't have time to persue this integration at this time. Other's may... so if someone built a renderer for this, I'd be willing to consider commiting it.
Comment #8
Pierre.Vriens commentedDavid, done as you requested: #2364427: Renderer for Charts and Graphs APIs. Curious to hear what Mick might think of it ...
Of course something that will take time for somebody (George?) to ever deliver it, so for sure not in the nearly-to-be-7.x-4.0 anymore. Let's consider it as the first major feature request that might make it into 7.x-5.x / 8.x-5.x some day (one never realizes what has been done, only what remains to be done ...).
Comment #9
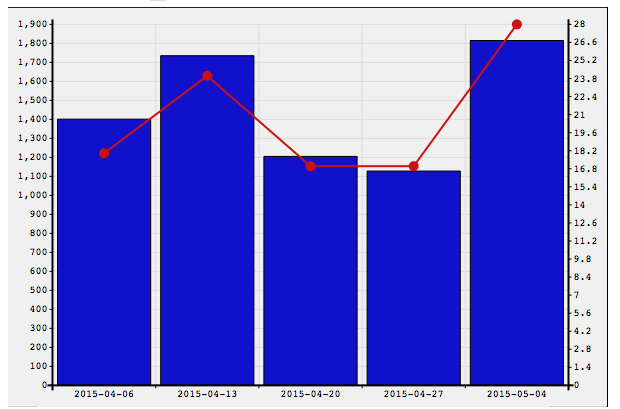
MickC commentedSVGGraph now has "BarAndLineGraph" in it's latest release - see here "http://www.goat1000.com/svggraph-bar.php"
However I can't get it to work using frx:type="BarAndLineGraph" frx:line_dataset="1"
This would offer a good option for a combi graph but does it need an update to the Forena module to accommodate it?
Comment #10
metzlerd commentedIt should not require any changes, but I'll download the new copy and do some testing to see if there is some other problem with it.
Comment #11
Pierre.Vriens commentedInteresting, both previous comments! But: I'm afraid it will require some (minor) changes. I.e. to translate "BarAndLineGraph" to the SVG Graph language used for it. At least that is what I remember from about a year ago when column charts where not yet supported by Forena. But of course: I hope David is right ... curious to hear how David's testing results will look like. Are the bets open now?
Comment #12
MickC commentedOK I got it going by inserting a line to forena/renderers/FrxSVGGraph.inc as follows:
Then added a 2nd Y axis using
frx:type="BarAndLineGraph" frx:dataset_axis_1="0" frx:dataset_axis_2="1"This is a result! Renders quickly too. Hope others find this helpful.
Thanks again David for a great module.
Comment #13
Pierre.Vriens commentedGreat MickC ! Your change now is close to what I did as described in #1953702: Add support for SVG Graph types CylinderGraph and RadarGraph, which is what I was referring to in #11 above also. Hang on for either David, or me, to actually get it committed soon. If you have a patch-equivalent of what you wrote in #12, then please add it to this issue. If not we'll work from the description you provided, ok?
Extra question: can you think of an enhanced version of the graph samples, in which you add such graph also?
Comment #14
metzlerd commentedHere's the above in an untested patch.
Comment #16
metzlerd commented