
On this page
- On this page
- Data aggregation and re-publication
- Displays
- News and list displays
- Map display
- Activity graph display
- Printable reports
- Channels
- Search and saved searches
- Widgets
- The about section
- Sharing tools
- Configurable geo-tagging
- Configurable maps
- Republishing stories as RSS feeds
- Exporting KML feeds
- See also
Feature Overview
On this page
- Data aggregation and re-publication
- Displays
- News and list displays
- Map display
- Activity graph display
- Printable reports
- Channels
- Search and saved searches
- Widgets
- The about section
- Sharing tools
- Configurable geo-tagging
- Configurable maps
- Republishing stories as RSS feeds
- Exporting KML feeds
- See also
Data aggregation and re-publication
At it's core, Managing News is all about aggregating data from various sources in a wide variety of formats. A common use case is setting up Managing News to aggregate news-oriented RSS feeds into a single feed, but data can also be drawn from a variety of other formats, including XML and CSV files. Once aggregated, the stories can be viewed in multiple styles (see map, list and activity displays below) searched, and channels can be created to collect stories into more meaningful groupings. Each collection of stories can then be republished as RSS feeds or embeddable widgets.
Displays
When viewing story collections, there are several viewing options: the news, map, activity graph and list displays.
The news display shows a heading with the first few lines of text. The list display is similar, but it will only show a heading. The map display will display stories on a map based on geo-targeted keywords in the text of the title and description of the story. You can switch between these different displays by clicking the display icons in the sub-header menu:

The activity graph is an additional display, which displays a heartbeat-style graph showing frequency of posts over time, and this displays in the upper right-hand corner of each feed, saved search and channel page.
Any visualization can also be added to the dashboard.
News and list displays
The default, or News method of viewing a feed or search contains a title, the first few lines of text for each story and the source. If you click the list display icon, you can see a condensed version of this which only displays a title:

Here is a screenshot of the News display:

And here are the same stories in the List display:

In either the news or list displays, there are a few things you can do to organize stories in a meaningful way:
By clicking on the pencil icon next to the Tags section below the story, you can specify tags that can be used to group posts into channels. As you type, any existing tags will be searched, and you can select these by using the keyboard or clicking with the mouse. You can add new tags as well, separating tags with a comma:

Once you have added a tag, you can click on it to view all posts with that tag.
Share
When you click the green (+) icon in the upper-right hand corner of a story, it opens up a share box at the bottom of the screen where you can share the story through various social networks like Facebook, Twitter and MySpace or compose an e-mail with information about the post pre-filled.
Read more about the share feature here.
Remove
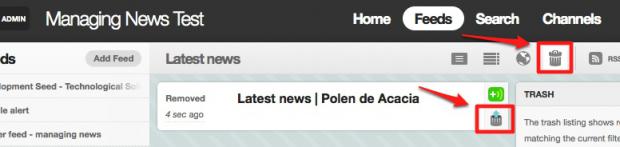
When you click on the trash icon to the right of a story, the item will slide up to disappear, and the story will be moved to the trash:

Stories in the trash can be restored later by going to the trash view when in the Feeds section by clicking on the trash icon in the sub-navigation, and then clicking on the restore icon:
Map display
Each collection of stories can be visualized on a map. You can view the map by clicking on the world icon in the sub-navigation:

There is also a small map box on the default and list view of feeds that works very similarly to the full page display:
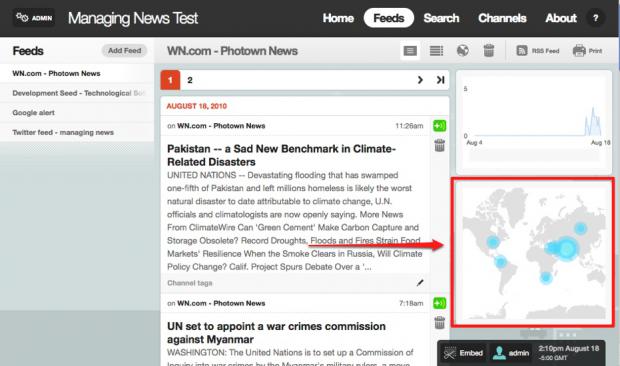
When stories are imported, Managing News will check to see if there are any geo-tags mentioned. If so, it will add the tag to the story and when you view a map, it will be marked based on the latitude and longitude of that geo-tag.
A single story will display as a small, transparent blue dot. Multiple stories in a single location will cause the dot to grow, and dots that overlap become more opaque. Below is a map display after a short world news feed was imported:

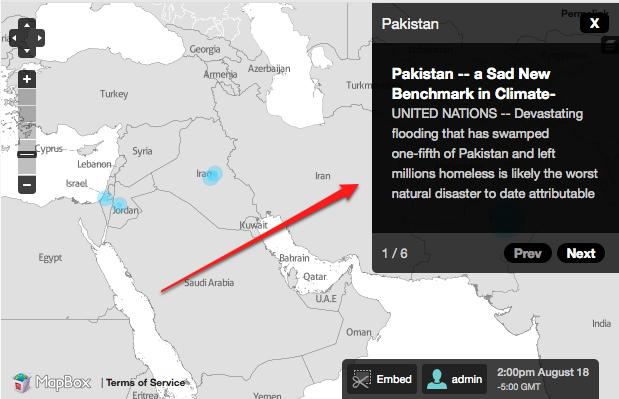
Here, we can see that Pakistan has had several stories, increasing the size of the dot. You can hover over a dot to see the geo-tag that the story matched. When you click on a dot, you will see a short snippet of one of the stories associated with an area, with the ability to scroll through the rest of the matching stories with Prev and Next buttons:
Activity graph display
Each story collection can also be visualized on an activity graph that displays daily activity over time. You can see this as a small box on the default or list display styles:
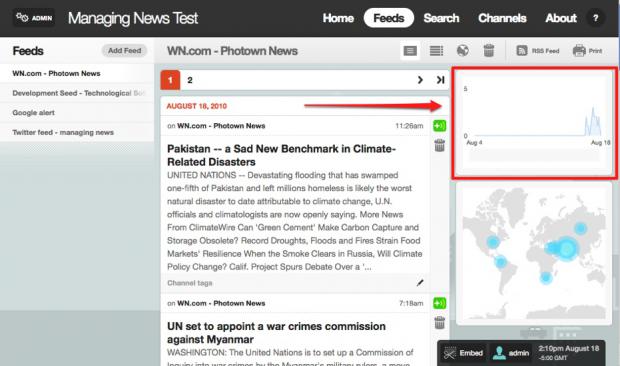
You can also add a box to the dashboard with a larger graph display. Spikes in this graph indicate increased activity in the story collection that you are currently displaying. As with any of the displays, you can narrow down matching stories by using the search or tagging stories for channels.
Printable reports
The print utility in Managing News can be helpful for offline reporting as well. Any feed, search or channel page can be printed in a simple, stylized format that's useful for quick review. To access the print utility, click the print icon in the upper right-hand corner:

This will open up a printable display that should look similar to what you see below:
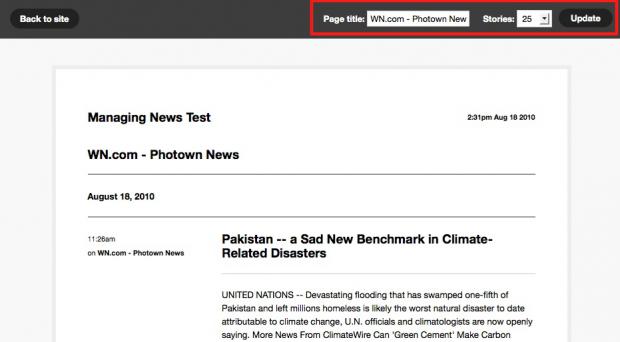
At the top of this page you can change the title and the number of stories to display. To print, just use your web browser's print function.
Channels
Channels allow you to aggregate stories by tags. For example, you could create a channel for stories you want to read in the next week, or a channel of stories to share with your team. If you have a public-facing site, you can use channels to aggregate filtered stories around a particular subject.
To create a channel, simply click the Channels tab at the top of the screen and click the Add Channel button:
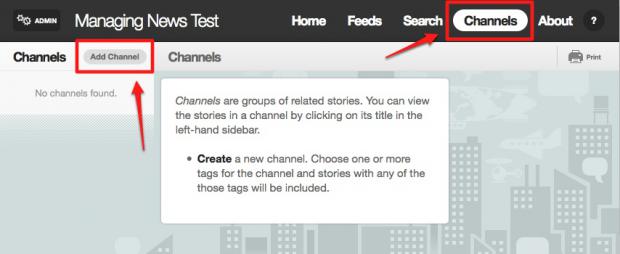
Here, you can add a title and description to your channel. The real power behind the channel is the ability to group multiple tags together:
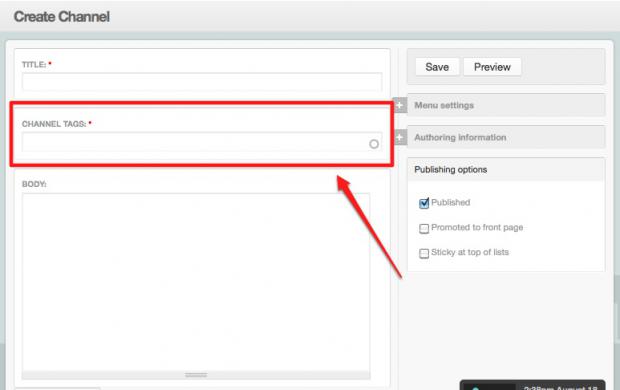
Simply select which tags you want to aggregate, and the channel will pull in stories that match any of those tags.
Search and saved searches
Once your stories have been indexed by Managing News, you can use the search tool to create sets of stories that match particular terms. Saved searches can be used on the dashboard, and each search has its own RSS feed. Read here for more on search and saved searches.
Widgets
Widgets are live, sharable boxes of stories that can be embedded on other web sites. Simply navigate to the story collection that you would like you embed, choose the display you would like (there are list and map displays of the widgets) and then click the Embed icon at the bottom of the screen.
Learn more about web widgets here.
The about section
The About section provides a way to add additional content pages that may be useful in conjunction with the aggregation tools. These pages can include anything from information about the organization running the site to helpful reference material. You can add as many pages as you would like to the About section, as well as re-organize pages in a hierarchy.
Learn more on the About section here.
Sharing tools
Whenever you are viewing a feed stream, you can share a particular story through e-mail, Twitter, Facebook or MySpace by clicking the green share icon next to the story. See Share News Via E-mail or Social Networks for more information.
Configurable geo-tagging
Geo-tagging is a method of using a lightweight tagging system to associate stories with locations on the globe. By default, Managing News comes with a pre-filled database of over 1000 locations including countries and large cities, but you can also import your own. This can be useful if you want to have a more localized map of a single country, region or city. For example, you could import a list of restaurants in your town and map restaurant popularity.
Learn more about custom geo-tagging here.
Configurable maps
Out of the box, Managing News comes with three base maps. However, you can add additional map layers, base maps, and even change the starting position and zoom level of maps.
Learn more about customizing maps here.
Republishing stories as RSS feeds
Managing News doesn't just aggregate stories, it also re-publishes them. Every story collection has its own RSS feed that can be syndicated to other feed readers. Just navigate to the story collection you'd like to syndicate - either in the Feeds, Search or Channels sections - and click the RSS feed icon in the upper right-hand corner:

Exporting KML feeds
In addition to re-publishing stories as RSS feeds, you can export KML feeds by clicking on the KML feed icon in the sub-navigation. KML data can then be viewed on 3D globe viewers like Google Earth.
Learn more about KML data here.

See also
Related pages
- Public Facing Site
- Configure the Dashboard
- Glossary
- Press Clipping Tool
- Search and Saved Searches
- How to Use Web Widgets
- Configure the "About" Page
- Share News Via E-mail or Social Networks
- Customizing Maps
External resources
Help improve this page
You can:
- Log in, click Edit, and edit this page
- Log in, click Discuss, update the Page status value, and suggest an improvement
- Log in and create a Documentation issue with your suggestion
