
This module allows you to render a chart in a text area using the Charts API. To use the text filter, you must first enable the Charts module, at least one charting provider (e.g. Highcharts), and this module. Then, you must enable the Charts Text Filter in the text format settings.
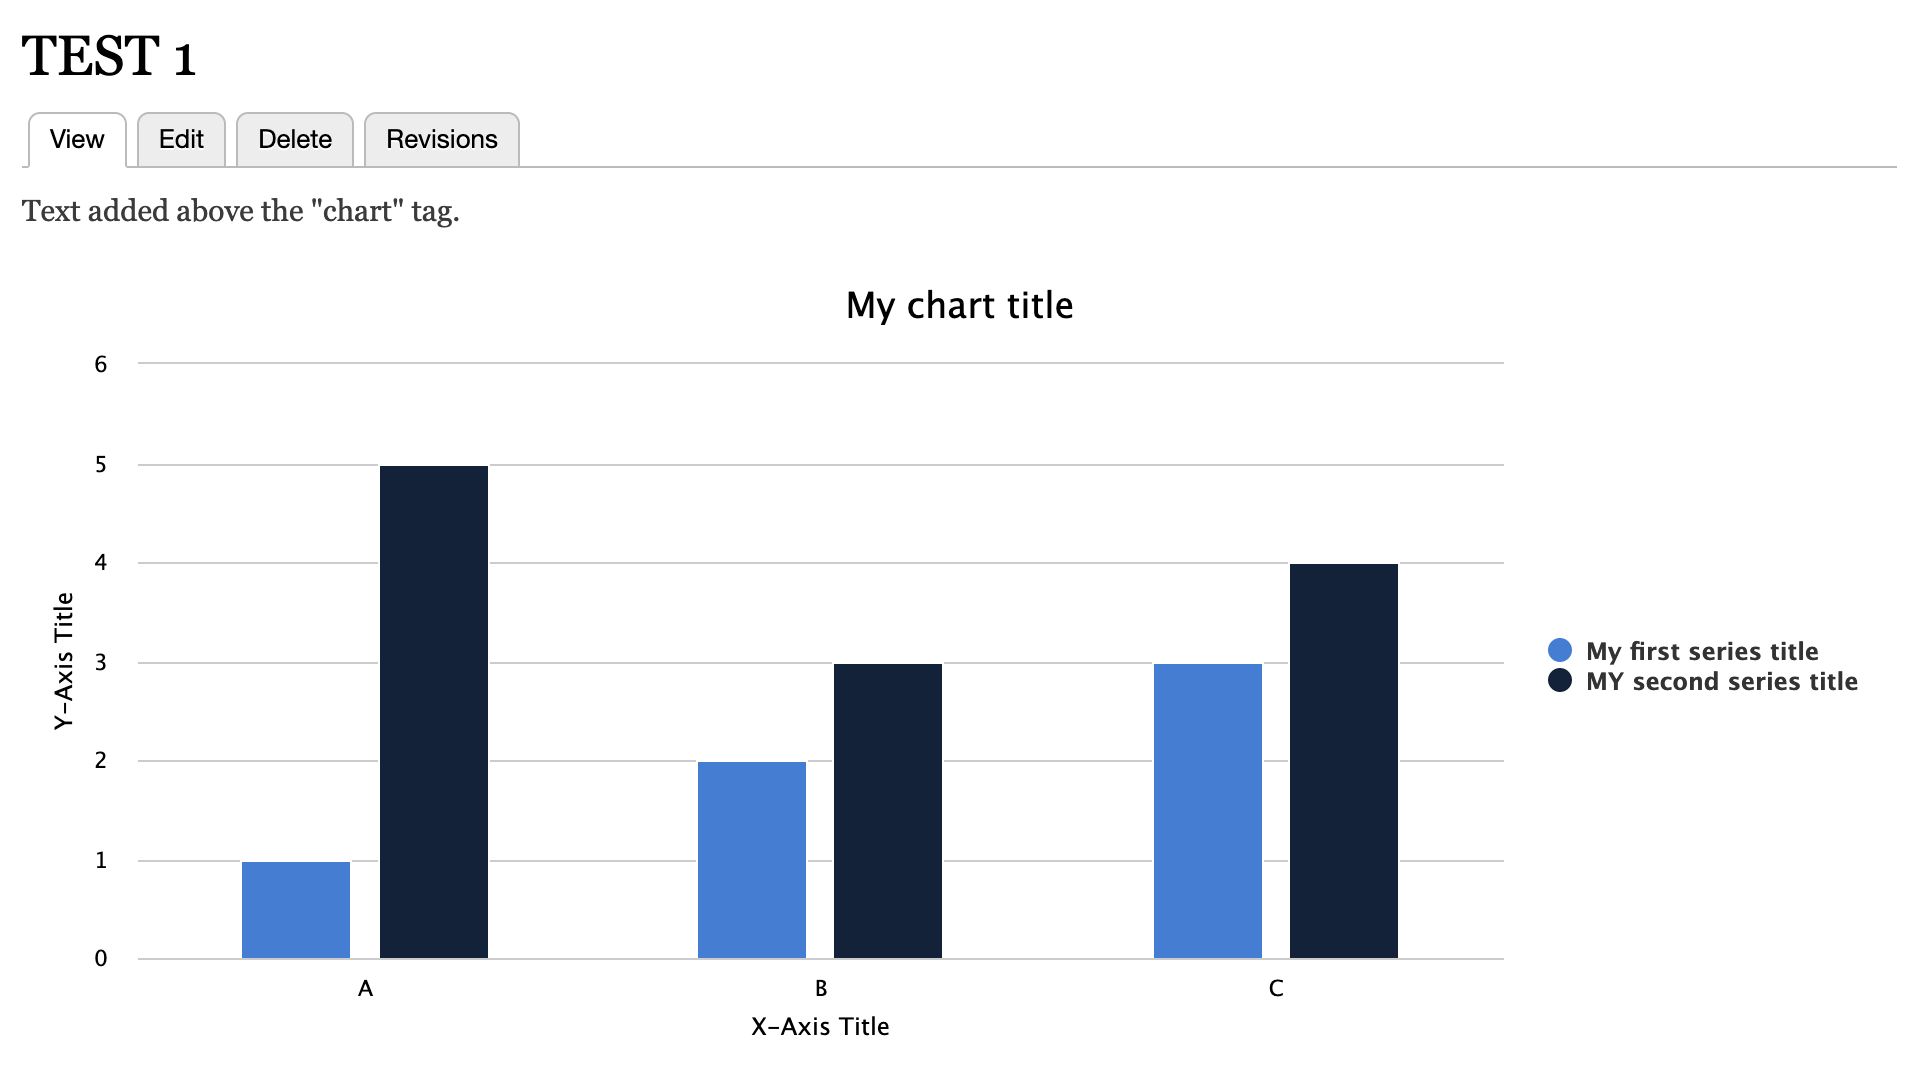
Essentially, the text filter allows you to add a chart using an empty tag with data attributes. Here's an example:
<chart
  id="my-chart"
  data-chart-library="highcharts"
  data-title="My Chart Title"
  data-chart-type="column"
  data-chart-series="my_first_series"
  data-chart-series1="my_second_series"
  data-chart-data="[1,2,3]"
  data-chart-data1="[5,3,4]"
  data-chart-data-title="My first series title"
  data-chart-data-title1="My second series title"
  data-xaxis-labels="['A','B','C']"
  data-xaxis-title="X-Axis Title"
  data-yaxis-title="Y-Axis Title"
  data-options="[]"
>
</chart>
This is an early, proof-of-concept version of the module. It is not yet ready for production use. Please report any issues you find.
Supporting organizations:
Module development and maintenance
Project information
- Module categories: Content Editing Experience, Content Display, Developer Tools
- Ecosystem: Charts
- Created by andileco on , updated
 Stable releases for this project are covered by the security advisory policy.
There are currently no supported stable releases.
Releases
1.0.0-beta1
released 10 April 2023
Works with Drupal: ^8.8 || ^9 || ^10
✓ Recommended by the project’s maintainer.
Install:
Development version: 1.0.x-dev updated 26 Oct 2023 at 14:16 UTC


