

 Come together with the global Drupal community in Rotterdam, 28 Sept – 1 Oct 2026. Sessions, contribution, connection, and Early Bird savings until 8 June.
I love how easy you can change implementation of the chart provider which this module makes possible.
In my application the customer is happy about the coolness of the flash charts, but at the same time worried that some users might not be able to view them (some of their users are using other devices than a PC for browsing their web site).
So I set out to write a provider based on the GD library that I can switch in for none flash-browsers.
I now have a first initial version of this module, which only has vbar2D implemented, and still needs some work to be perfect. Most notably on my roadmap is:
- Admin feature to clean up via cron (it writes an image to the disk for every chart generated)
- Implement at least line2D
I was wondering if you would be interested in including this provider as part of the Charts module? If so I will start being more thorough in my clean up, and think more general purpose use into it, rather than just custom make it for my specific application.
| Comment | File | Size | Author |
|---|---|---|---|
| #2 | test-negative-charting.png | 1.07 KB | kekkis |
| #1 | gd_image_chart.tgz | 4.06 KB | madsph |
| gd_image_chart.tar_.gz | 2.7 KB | madsph |

Comments
Comment #1
madsph commentedStill not sure if any body else needs this - but just in case, here is an updated version with an admin interface to set up path to temporary images and control deletion of images via cron. Also line2D is now available.
Comment #2
kekkisVery good start but I would like some more flexibility through the schema: the ability to set colors and vbar sizes programmatically, for example. Also, the vbar side is not very proficient in showing negative values, the grid always starts at 0 in your version.
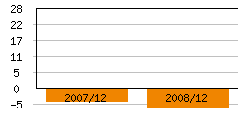
I realise this comes in a bit late but I would really appreciate help in setting this up so that it can show negative values in a flexible manner. I've made some changes in gd_image_chart.inc but there's still some way to go as the starting point won't move; the grid does extend downwards but that doesn't comfort too much as the bounding box is in the wrong place. See attachment: test-negative-charting.png.
Comment #3
madsph commentedIt has been a long long time since last I last looked at this, so I may be way off on this. But as far as I remember the graph is scaled by the
$maxvalvariable. My guess is that you need to introduce a$minvalvariable as well and then use difference between min and max in stead of just max in the further calculations (you might want to check that max is >= 0 and that min <= 0).Comment #4
kekkisAfter nearly a year, I certainly didn't expect a response this quickly; thank you!
More to the point, I did introduce a min_value so that now the code in gd_image_chart_image looks like this:
And
But this results in what I attached above; the 0 line is still at the bottom. Any pointers as to how that could be moved up dynamically as needed would be nice. The data in the attachment is [-4.8, -22.8] and it is not reflected very nicely.
Comment #5
brmassa commentedMads,
hoy!! after staying away from Drupal so long, i see a quite nice implementation! thanks a lot. Users might now use Charts (line and bars at least) almost without external libs (since gd is de facto standard library)!
commited and soon on the next release.
regards,
massa
PS: would you like to be a co-maintainer?
Comment #6
brmassa commentedComment #8
robertwb commentedWondering if this plugin is being moved to Drupal 7 and 8? I have a real need for it. If anyone has done so, please let me know, or if there are any interest in co-developing I am available.
Regards
Comment #9
quicksketch> Wondering if this plugin is being moved to Drupal 7 and 8?
This module was ported months ago to Drupal 7, but it does not include a GD-based charting library (nor will it, more likely than not). The issue for D8 porting the entire module is at #2140651: Port Charts to Drupal 8.
For the GD-version of a charting library, I'd suggest an add-on module that stands alone, similar to https://drupal.org/project/charts_rgraph. I wouldn't want to maintain a custom charting solution as part of this project.
Comment #10
robertwb commentedThanks @quicksketch - it makes total sense that this should be a plugin, just like any other output option. IMO this is a huge need, though, because once one moves beyond "small data", nevermind "big data", client-side javascript based solutions are a performance killer.
Comment #11
Pierre.Vriens commentedI'm interested in getting more info about what's in comment #10. Also, would the SVG Graph library be a possible alternative to consider as a remedy? That library is open source, written in PHP, and used in forena.
PS: what exactly is the "GD library"? Any link for more details on it?