 Support for Drupal 7 is ending on 5 January 2025—it’s time to migrate to Drupal 10! Learn about the many benefits of Drupal 10 and find migration tools in our resource center.
The Plotly.js Graphing module provides a fully customizable implementation of the open source Plotly.js graphing library.
This module provides a new field type which allows for addition of any type of Plotly.js graph to your content.
Plotly.js graphs include:
- Area Charts
- Bar Charts
- Box Plots
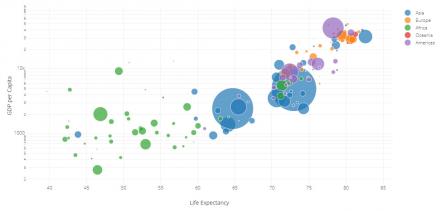
- Bubble Charts
- Candlestick Plots
- Carpet Plots
- Choropleth Maps
- Contour Plots
- Density Plots
- Heatmaps
- Histograms
- Line Charts
- 3D Meshes
- Open-High-Low-Close (OHLC) Charts
- Parallel Coordinates Plots
- Pie Charts
- Point Clouds
- Polar Charts
- Sankey Diagrams
- Scatter Plots
- Ternary Plots
- Treemaps
- and more!
This module requires no knowledge of Javascript - all graphing implementation is performed through configuration settings on the Plotly.js fields provided by the module. Simply add the fields, pick your graph type, and you can start adding the graphs and configuring the display settings for each piece of content you create.
Project information
- Module categories: Content Display
27 sites report using this module
- Created by Daniel.Moberly on , updated
Stable releases for this project are covered by the security advisory policy.
Look for the shield icon below.
Releases
Drupal 9 and 10 compatibility
Development version: 3.x-dev updated 4 Feb 2023 at 22:12 UTC
Fixing error in service call
Development version: 8.x-1.x-dev updated 3 Feb 2023 at 21:08 UTC


