Using the DEIMS Data Explorer
What is the Data Explorer?
The Data Explorer is a DEIMS feature that enables you to connect to an external database to query its data tables.
Here is a textual description about the data explorer pages. After this, you will find a specific usage example. To set it up, configuration and gotchas, please visit the corresponding sections.
How do we use the Data Explorer?
The Data Explorer offers a query system for external databases. When the module is configured correctly, you will have access to a query page for each of the external tables that are described in DEIMS. Each Data Explorer query page has two parts. The top part allows the user to pick which fields he/she wants to query, allowing scientists to easily subset a table. I.e, say we have a hydrological table with a Date column, a Temperature column, a Discharge column, Conductivity and Quality flag columns. The scientist may just want to download a Date and the Discharge values., and that is what he/she can select on the top part of the Data Explorer interface. The lower part of the query page allows filtering value ranges or thresholds from each of the data table columns. For example, you may just want to narrow your query for a range of dates, set a temperature threshold, or exclude rows that have been tagged with quality control codes qualifying the validity of the overall measurements. In our example, say our scientist wants to subset all the data stream for the dates going from Oct 10, 2003 to Sept 2, 2006, exclude questionable records, and showing only above freezing temperatures. This is what you do in the lower part of the data explorer. Once our scientist is happy with his query, he can either preview the results, or download them.
A graphical use example. Your setup may vary a bit depending on the look and feel customizations or other improvements, but should essentially resemble what you see here.
Here is a snapshot of my Data Explorer Dashboard, a view I accessed through my main menu at http://mydeims/data-explorer-dashboard
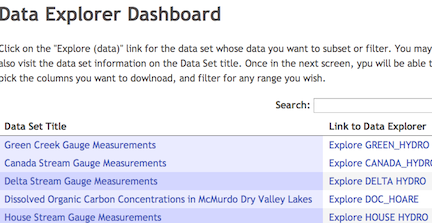
Next, let's explore the “Delta Hydro” data table, clicking on the link at the right dashboard column. The link lead to the Data Explorer query page, which is divided in two parts. The upper part allows us to select which of the columns we want to query and download data from. See most of it in this shot:
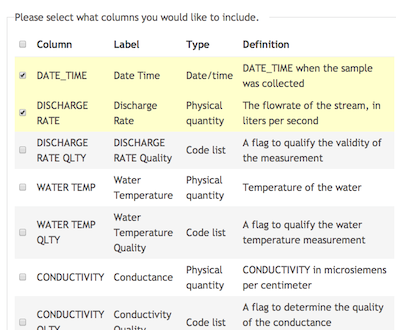
Notice, the first two columns radio buttons are checked, as we are only interested on the date-time when the discharge (flowrate) was measured, and the discharge value itself. The of the data columns remain unchecked. Furthermore, we want to filter, subset the range of values. The DEIMS Data Explorer query page lower part allows us to subset and filter to narrow the final results. Let us see the interface.
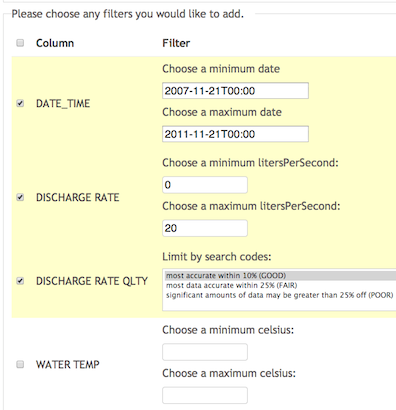
Using the Date-time range (use the calendar pop-up or ISO-formatted dates), we have selected 4 years worth of data, from november-11 2007 to same date on 2011. We also filtered only high confidence values (tagged with “GOOD”) and limited the results to discharge values on or below twenty liters per second. We could have added any other ranges on the rest of the column filters. It is important that you use the checkbox to the left of the filter you want to apply.
Finally, you have the “Web Preview” and “Download” buttons at the bottom of the query page. You may choose either of them. Be patient with the “Download” for large datasets, depending on your query, you may be requesting Gigabites worth of data!
Here is what a preview may look like for the example above:

Help improve this page
You can:
- Log in, click Edit, and edit this page
- Log in, click Discuss, update the Page status value, and suggest an improvement
- Log in and create a Documentation issue with your suggestion
