
 Come together with the global Drupal community in Rotterdam, 28 Sept – 1 Oct 2026. Sessions, contribution, connection, and Early Bird savings until 8 June.
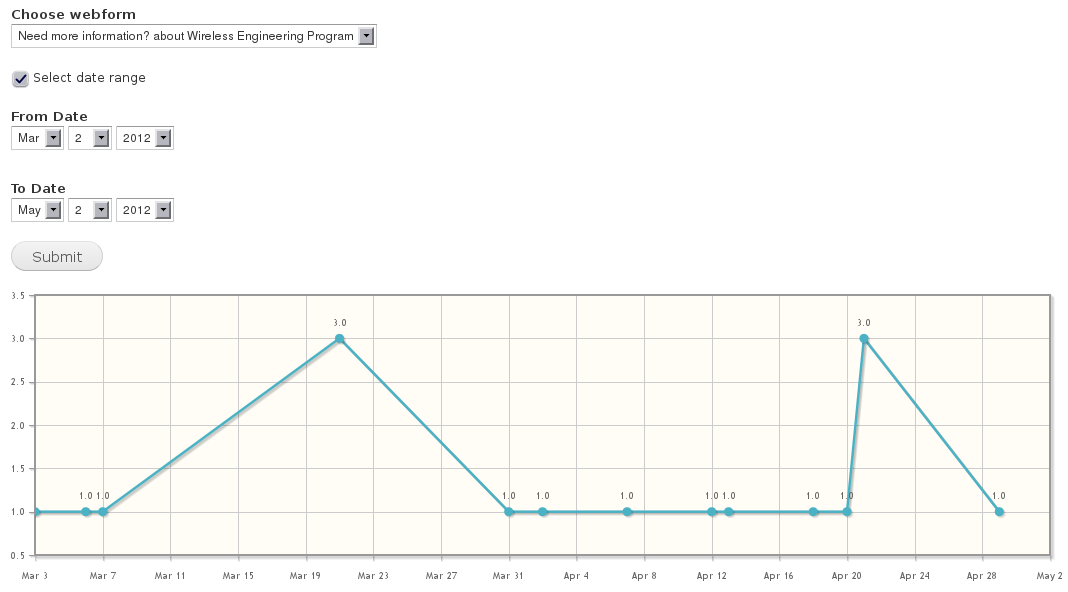
This module generates charts for webform submissions by the uses. Site admin can how many submissions are done between a certain time period.
Using it site admin can see the charts for submission data for certain period. It uses JqPlot JQuery plugin to generate charts.
Installation:
- Download jqplot module and jqlot library
- Download and copy module to sites/all/modules folder
- Assign permission "access all webform results" to the role for which you want to allow to see webform reports.
This module is no longer in active development.
Project information
 Unsupported
Not supported (i.e. abandoned), and no longer being developed. Learn more about dealing with unsupported (abandoned) projects- No further development
No longer developed by its maintainers. - Ecosystem: Charts
 42 sites report using this module
- Created by sharique on , updated
 Stable releases for this project are covered by the security advisory policy.
There are currently no supported stable releases.


