

Closed (works as designed)
Project:
Table to Chart
Version:
7.x-1.4
Component:
Miscellaneous
Priority:
Normal
Category:
Support request
Assigned:
Unassigned
Issue tags:
Reporter:
Created:
15 Jul 2015 at 07:23 UTC
Updated:
15 Jul 2015 at 12:00 UTC
Jump to comment: Most recent


Comments
Comment #1
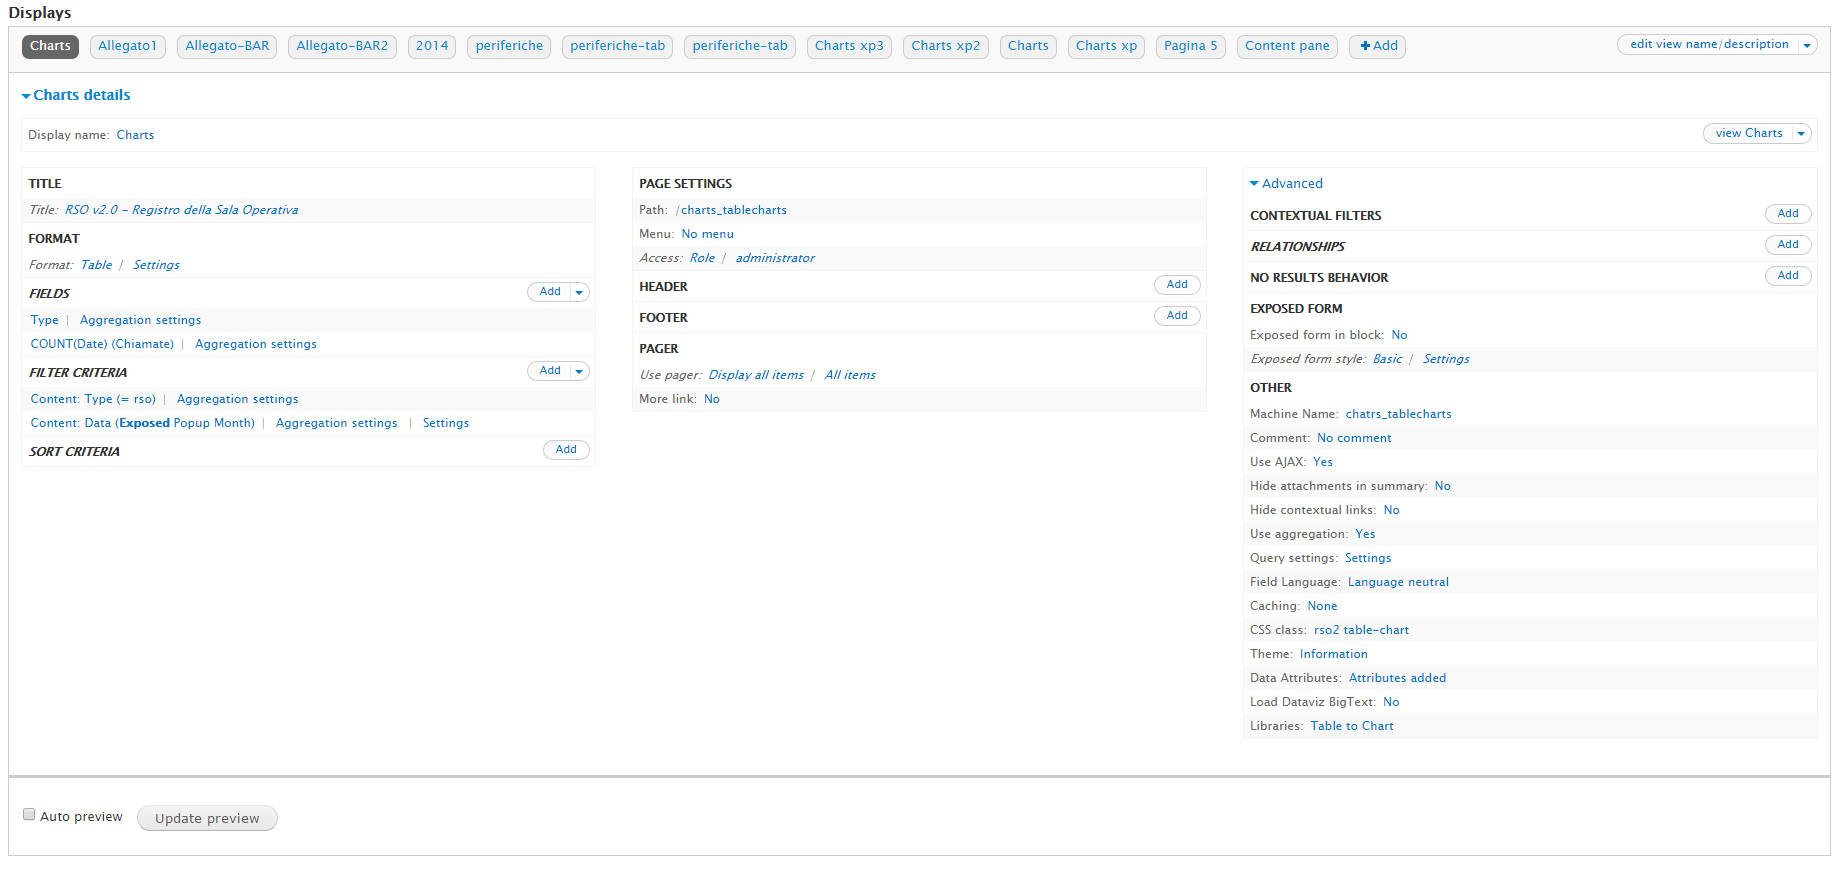
Mirkozzo commentedI created a simple test views, i tried all morris-type, but it works only bar, line and area is not working, donut show white space.
morris-type=line
morris-type=donut
morris-type=area
morris-type=bar
Comment #2
minoroffense commentedDonut charts require your fields to be labeled "label" and "value" as per the documentation on Morris charts.
http://morrisjs.github.io/morris.js/donuts.html
Line and area require you to specify the xkey and ykeys values in the data attributes. See http://morrisjs.github.io/morris.js/lines.html
Check to make sure your generated tables and data attributes match up to what the Morrisjs library requires.
Bar is the least picky of the chart types which is probably why it works just like that.
If you have anymore questions post them here.