
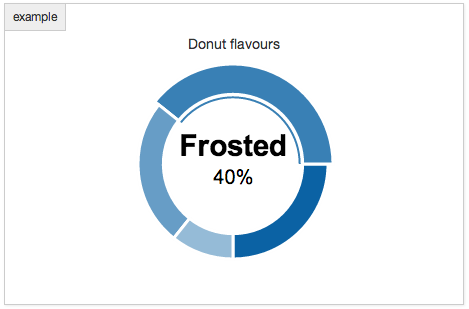
Convert a table of data to a chart.
This module allows you to take a table of data, convert the values to JSON and then display those values as a chart (e.g. Line, bar or donut). The default library used for creating the charts is Morris.js.
Upcoming changes to 1.6
An external library has changed some file names. Meaning in 1.6 you'll need to make the necessary changes to your site beyond just updating the module. See the release notes for RC1: https://www.drupal.org/project/table_chart/releases/7.x-1.6-rc1
New as of v1.5
You can now use Views Aggregator Plus tables with your Table to Chart configurations.
Help getting started
Check out my presentation at DrupalCamp Montréal 2014 on how to use Table to Chart in detail.
Professional Support for Table to Chart
If you're stuck in the issue queue or need one-on-one help with this module you can book a time slot to discuss the issue with a developer. The help is free if it's resolved issue in the half hour time slot. For extended support you can request a quote at http://coldfrontlabs.ca/contact. Be sure to select "Support" as the subject.
Sponsored by Coldfront Labs Inc.
Maintainer Mathew Winstone (minorOffense)
Supporting organizations:
Developer resources
Project information
- Project categories: Content display, Developer tools, Integrations
 27 sites report using this module
- Created by minoroffense on , updated
 Stable releases for this project are covered by the security advisory policy.
There are currently no supported stable releases.


