
Closed (fixed)
Project:
Drupal core
Version:
8.7.x-dev
Component:
typed data system
Priority:
Critical
Category:
Bug report
Assigned:
Unassigned
Reporter:
Created:
26 Jun 2018 at 18:23 UTC
Updated:
12 Jul 2022 at 19:40 UTC
Jump to comment: Most recent, Most recent file

Comments
Comment #2
timodwhit commentedThis issue will also show itself on the Block placement page.
Comment #3
eclipsegc commented@timodwhit
Hey so, yeah any time we have to validate a context, it's slow. This actually has nothing to do with the context system and everything to do with entities and their validation. Context is just dependent upon it because that's the system that was implemented and has been in core since the days of 8.0.0. I'd LOVE to see a validation method that's less heavy handed... simple instanceof checks would suffice for 99% of the context system's use case, however, the abstractions that exist prevent us from easily introducing that, and beyond that there are use cases outside that situation for which the existing validation approach future proofs us a bit.
These regressions should mostly exist administratively, and in fact your own report seems to indicate that is the case. Are you seeing regressions after page caching has happened for the rendered result of these things? I've not experienced any administrative slowness that wasn't directly related to some misconfiguration of my own local environments.
Eclipse
Comment #4
timodwhit commented@Eclipse
Thanks for the response. Totally get that this is the best case scenario to future proof us.
As for page caching, I'm not sure if that would help much in the sense that each page that is loaded would get a new cache. Example: node/123 would get 1 cache insert for the layout builder and node/345 would get another one.
With the validation times we have been seeing with standard, this is a fairly significant load increase for TTFB alone because of the heavy handed approach. This then beckons the question of is the 99% use case enough and the rest should be a custom implementation?
Just for an example of how dramatic the load differences were: Panelizer for us went from 1-2 sec loads to over 30-45sec loads.
Comment #5
eclipsegc commentedThat is very strange. No one else is complaining of that sort of speed difference to the best of my knowledge. Anything else in your scenario that could be contributing?
Comment #6
timodwhit commentedYeah, wanted to run some tests on simplytest.me and get some TTFB stats. The times are derived from standard with panelizer and dependencies installed. The times were grabbed from the article content type with layout builder when clicking the "Add Block" button. The node types added were simple nodes with a body field named Type 1, Type 2, etc.
If you notice that (as expected) the more node types you add the greater the time. Unfortunately, on simplytestme the use of 8.4.8 is breaking and not installing properly, so I could not get the times from 8.4.8. If someone could test reverting ContextHandler to the 8.4.8 state and getting some numbers it could be valuable to see the time difference.
Locally, that massive of a slow down is some inclination of another issue, however the massive variance in speed between the two is intriguing.
Couple reasons we might not hear about this:
1: Layout Builder is experimental and not in the wild too much
2: Panelizer/Block Layout aren't known for their speed, also amongst sites that are set up. They might not be in the common editorial workflow.
3: Maybe the number of node types, blocks, etc, is low enough that the plugins loaded aren't recursing over a lot of data.
Comment #7
timodwhit commentedDidn't mean to attach that...
Comment #10
nebel54We are experiencing major performance problems after enabling the layout builder module - even without activating it for content types. I am not entirely sure why it slows down our site so much, because I was not able to reproduce the problem with a vanilla install and generated content.
Our page has currently:
Nodes: 31.323
Content-Types: 26
Active languages: 37
For benchmarking I did a curl call to an overview page with multiple paragraphs & entity reference fields. The paragraphs also contain entity references (and some kind of inheritance). In total are 16 paragraphs shown on this page. Drupal Version is 8.7.1, render caches are disabled (except for the twig cache), XDebug enabled.
Command: time curl https://page.docksal/langing-page > /dev/null
1st run (layout builder is disabled):
real 0m4.694s
2nd run (after drush en layout_builder):
real 1m16.202s
3rd run (no changes, but with rebuilt registry):
real 0m52.327s
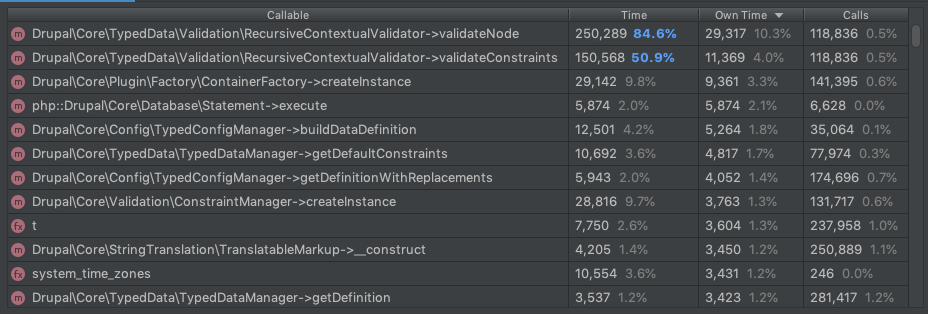
After doing a bit of profiling, I noticed that RecursiveContextValidator->validateNode & RecursiveContextValidator->validateConstraints are executed 118,836 times, which seems to be the showstopper.
I think the underlying problem is that LayoutBuilderEntityViewDisplay always tries to load possible layout_builder sections for each entity, even if the layout builder is not enabled for a specific entity-type and view-mode. The attached patch solved the problem for us through not loading the layout_builder contexts if the layout builder is not active. But I think there are more issues with the validator because I could not figure out why it called itself so often for 30-50 related entities.
Comment #11
nebel54Comment #13
nebel54I just took a look at the failed test: The test checks if the section storage for a specific node still works AFTER the layout builder has been disabled for a node-type. It is not possible within the UI to disable layout builder as long as node-specific layouts exist. My plan is to adopt (remove) this test case if there are no objections.
Comment #14
grantkruger@Nebel54 I'm in the same boat with fewer content types, less than half the content and no translations. I'm working locally on Lando (docker wrapper) on a Mac and that has its own issues, but I can still compare before and after. All I have to do is enable the layout builder module and my site's performance immediately becomes unworkable and the app container gets overloaded and does not recover for a while. I'm not doing performance tests but rather I'm simply running a backstopjs visual regression test suite that tests 50 pages (25 regular and 25 mobile). Here's my flow.
The failure point is similar from my local site if I navigate it as normal, e.g. working with views or creating content, etc. Response times quickly slow and then I start getting either very very slow loading pages, failing ajax calls or 503 errors from Varnish.
I have a couple of things to do first but then I'm going to try two things.
I'll report back when I get the chance, but in the meantime I wanted to reply to say thanks and that you might want to try 8.7.2 too.
EDIT: 8.7.2 does not fix the problem.
Comment #15
grantkrugerPatch at #10 works for me on 8.7.2. Per my comment at #14 after applying the patch my response time is little different to what it was before, maybe just a bit slower. Thank you Nebel54.
Comment #16
nebel54@grantkruger: Thank you for your feedback!
I have updated the patch and removed the failing test. I did this not out of convenience but because I think that it does not make sense that layout sections are still rendered after the layout builder has been disabled globally in the content-type configuration. I would assume, that the rendering falls back to normal behaviour in that case.
Comment #18
nebel54Fixing the broken test…
Comment #20
nebel54Fixing the broken test again… this time it succeeds locally
Comment #21
nebel54Comment #22
grantkrugerIn my case I can see a huge performance hit merely by enabling the modules and your patch stopped that issue. I'm not sure why it's affecting some of us and not others. In our case we have a lot of complex layouts full of blocks and paragraphs and I wonder if that is a part of it. No time to dig right now, just glad this gets Layout Builder to work for me because I'm really enjoying the tool so far, even though it is a bit buggy.
Comment #23
nebel54Comment #24
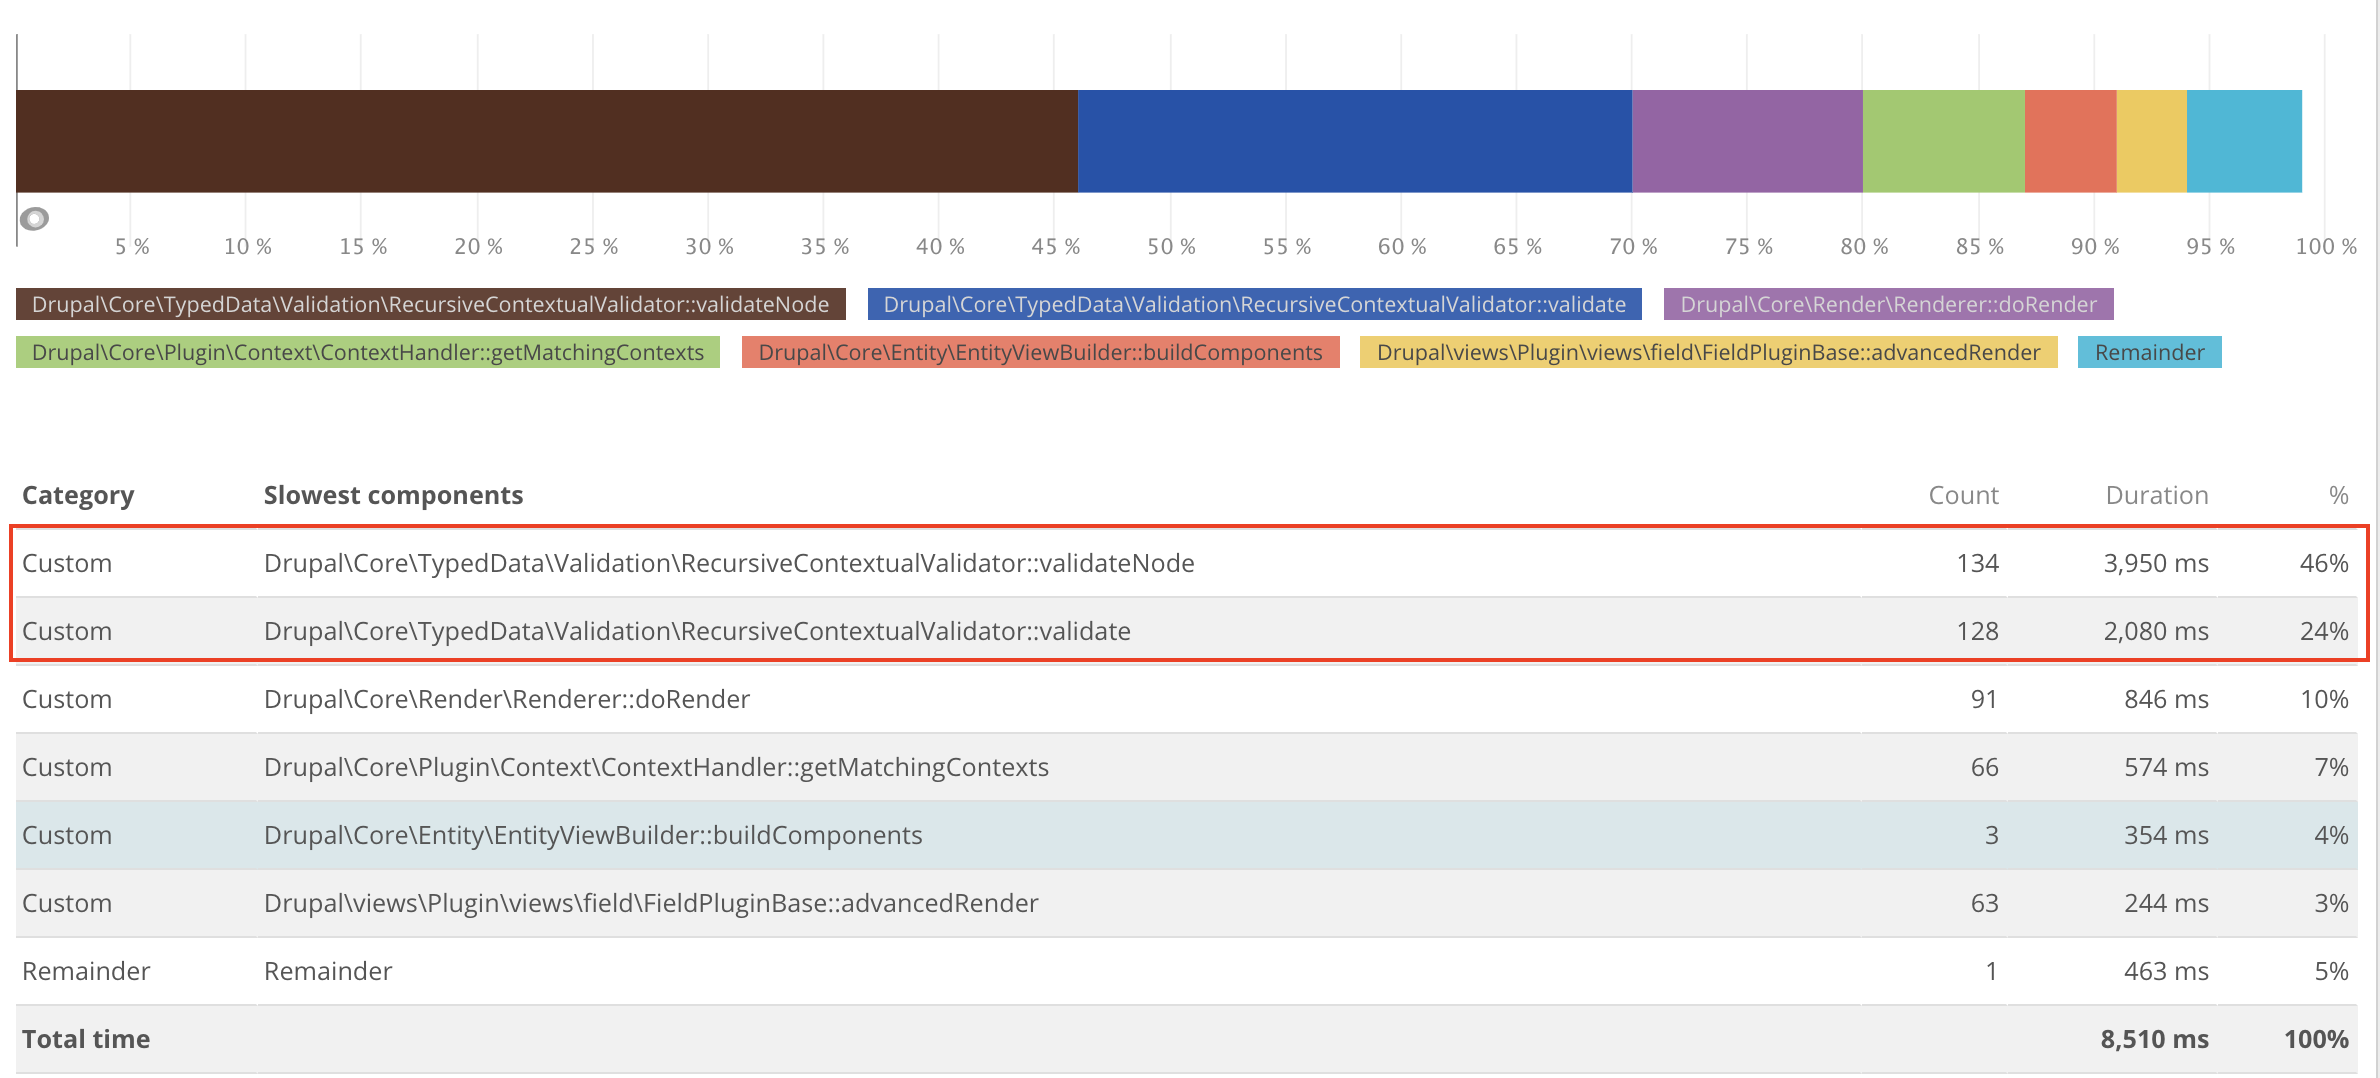
bkosborneThis hit me today as well. I upgraded a site from Drupal 8.6.x to 8.7.x, and immediately noticed a performance issue in New Relic, specifically on views page that listed hundreds of results. The first page load is cached, but there are exposed filters that filter the results via AJAX. Those requests took 30-40 seconds to load.
Here's the trace summary in New Relic:
For me, this patch works great, but I think I'm lucky because the view is outputting results using fields instead of rendered data. The entities that are being returned DO have layout builder enabled, but not for the "_custom" view mode that Views is using for rendering the row output, so this patch works.
Comment #25
tim.plunkettSee also #3023220: Performance: Prevent extra Layout Builder code from running when rendering fields in isolation (Views results, FieldBlock, etc).
The test change here is incorrect and will break contrib. I haven't read every patch and comment to see when it was decided to undo the test coverage, but we can't do that...
Comment #26
tim.plunkettIn fact I think this is a duplicate of that issue?
Comment #27
bkosborneSort of, but the fix in 3023220 checks if the view mode is custom and backs out, whereas this patch backs out if layout builder is enabled for the display. What about legit (non-custom) view modes that don't have layout builder enabled? Patch is 3023220 won't handle that.
I understand that that calling isLayoutBuilderEnabled() breaks contrib though and cannot be used.
Comment #28
bkosborneComment #29
nebel54I am aware of the altering-the-test-problematic, but I am unable to think of a reason why the old test expected a layout-builder-layout when the layout builder has been disabled on the content-type level. I would suspect that a feature is disabled after it was disabled…
Comment #30
tim.plunkettBecause LB defaults (the one controlled via Manage Display) is only one implementation of SectionStorageInterface.
See TestStateBasedSectionStorage for a test-only implementation that is controlled independently of that checkbox.
This is to simulate contrib solutions like Layout Library that are similarly not controlled by that checkbox.
#27 is correct.
This issue should be repurposed to focus on allowing entity types to opt-out of these LB checks for their full entity rendering, as 3023220 fixes the main perf hit of rendering individual fields.
Comment #31
nebel54@tim.plunket: Thank you for the explanation!
Comment #32
sam152 commentedI think I logged a dupe of this. Adding as related.
Comment #33
grantkrugerSo we have issues 2981889 (this one), 3023220 (mentioned by tim.plunkett) and 3043319 (mentioned by Sam152) all for similar issues and all having different solution patches. Which do we apply? Sounds like bkosborne did both this one and 3023220.
Comment #34
fagoComing to the party from #3060985: Layout Builder attempts to builds sections to determine if it is disabled - thanks to tim.plunkett for the pointer.
I noticed also that layout builder triggered entity validation as part of checking whether contexts are satisfied. I think this is wrong and at least partially the reason for the performance degression: it wants to verify whether the entity matches the context definition, e.g. entity type and possible other custom cosntraints in their match, but that should involve validating the entity as such imo.
Comment #35
tim.plunkettI don't know how else to check constraints without calling
$validator->validate($value, $constraints).See
\Drupal\Core\Plugin\Context\ContextDefinition::isSatisfiedBy()Any pointers here would be appreciated
Comment #36
grantkrugerThis patch worked fine until I tried updating to 8.7.3. It still works, but Now my site is slower again...occasionally, most noticeably sometimes after clearing caches. As before, run my test suite, see issues. Then keep running them and it all clears up. It's better than before but mildly terrifying to have new issues introduced with new versions of core that are reportedly fixing Layout Builder bugs. Is anyone working on these broader issues? I can keep adding patches from other issues, but this seems to be affecting many folks and appears to be a critical issue. My D8 chops and tools are not up to snuff for helping with an issue like this one, but I sure can test things.
Comment #37
tim.plunkettThere was nothing added between 8.7.0 and 8.7.3 that would degrade LB performance.
And 3023220 was committed in between 8.7.2 and 8.7.3 and greatly *improved* performance...
So without any concrete info on what 'slower again' means, idk what is actionable
Comment #38
grantkrugerFair enough. I'll try and tie it down. Thanks.
Comment #39
bkosborneOk, so I think there are still two issues we're dealing with here:
1) LayoutBuilderEntityViewDisplay::buildMultiple attempts to build layout builder section render data even if the entity view display is NOT using layout builder. But based on comment in #30, I guess we can't actually perform this check due to the abstraction of the section storage layer?
2) Even if the first issue were to be resolved, there is still a big performance penalty for rendering entities that have layout builder enabled on the display that's being rendered. This is most problematic when rendering multiple entities at once, like in views results. There is a patch in #3043319: Real world rendering of a layout builder page is much slower with calls to ::filterPluginDefinitionsByContexts in SectionStorageManager::findByContext that passes tests but not sure it's correct?
Comment #40
bkosborneHere's @Sam152's patch from the issue he created. If this gets committed, please be sure to credit him. This patch addresses the 2nd point I made above in #39.
As he said before, this patch no longer filters the section storage plugins by context. However, it still runs "isApplicable" on each one of them to determine which ones should be allowed.
Is it necessary to filter the plugin definitions at all since we have that isApplicable check?
Comment #42
josephdpurcell commentedRegarding whether anyone is seeing a performance issue with Layout Builder, I can confirm we are seeing consistent 10 second TTFB on some requests that appear to be related to `\Drupal\Core\TypedData\Validation\RecursiveContextualValidator::validateNode()` as described in the ticket. I'm attaching some stack traces from New Relic that might be helpful for comparison if anyone (a) sees a similar trace, and (b) one of the patches in this thread solves the issue.
I have not tested a patch and I have not done a comparison with Layout Builder disabled vs enabled to ensure what I'm seeing in these traces is in fact related to Layout Builder.
Comment #43
tim.plunkettThat is indeed the problem caused by the TypedData system, as exposed by Layout Builder.
But, the FieldPluginBase part of that screenshot makes me wonder if you're running 8.7.3 or something older than that, as this should have been improved by #3023220: Performance: Prevent extra Layout Builder code from running when rendering fields in isolation (Views results, FieldBlock, etc)
Comment #44
fagoI also ran into this severe problem - pages loaded multiple seconds due to this.
While debugging I figured problem is that entity validation is kicked off while the code only validates a few constraints against a certain entity. This is due to the typed data validator recursing by default, what makes sense for field items etc, but not when validating against an entity. Thus, attached patch disabling the recursing when some constraints are validated against an entity. IT's only disabled when custom constraints are passed in, so it should be safe (even though I cannot think of a case where entity objects should be validated in a nested way).
Attached patch solves the issue.
Update: sry, patch is against 8.7. - but should apply against 8.8. as well
Comment #45
tim.plunkettThat looks promising!
Can you provide any profiling data for the before/after?
Comment #46
gnikolovskiWe also ran into this problem.
After applying the patch provided in #44 site works much faster.
Here's the profiling data before and after (profiles will expire in a day):
https://blackfire.io/profiles/2b2da7d8-e088-46f8-a9bf-46c40b19cc67/graph
https://blackfire.io/profiles/d95c4951-69de-4b1c-a6c7-2e814db298fb/graph
Comment #47
tim.plunkettHere is the relevant LB part of that callgraph


Before:
After:
Comment #48
tim.plunkettHmm, I think there is an issue with the "after" profiling.
RecursiveContextualValidator::validateNode()doesn't appear in the callstack at all, which is the method that was changed here. Perhaps the after had some caching kick in.Comment #49
eiriksmJust to chime in with some initial testing of this patch. It's a MAJOR difference for us.
Our client has a huge landing page consisting of rendered entities, banners all kinds of things. Attached a gif of me scrolling down the layout tab for an idea of the amount (also because even if i zoomed out as much as it was possible it was not possible to get a screenshot of all the blocks).
This takes ~28s on cold caches on my machine.
With this patch applied it takes ~11s.
Here is the data for this:
What can I do to help this issue moving forward? Do we need more profiling? I can create some xhprof files if that helps?
Comment #50
eiriksm...also tested with a luke warm (patent pending) cache.
First request /user/login to get some initial cache filled. Then request the landing page.
Without the patch:
~26s
With the patch:
~8s
Here are the methodology and data for those numbers:
Comment #51
sam152 commentedJust some more anecdotal evidence to add to the pile, here is a graph from new relic of a site in production running LB. Can you guess when the patch was applied? :)
Comment #52
tim.plunkettThanks!
Comment #53
larowlanAs much as I want to commit this - its a bugfix, so as such should come with some test coverage - can we add a test here to prevent a future regression?
Comment #54
acbramley commentedTaking a look at writing a test
Comment #55
acbramley commentedNaming, comments, and the rest are probably off here but this is a super simple test to demonstrate the fix.
Comment #57
shaal@larowlan pointed me to this issue.
When comparing #3086583: Installing layout_builder module after Umami content import completed and this issue, results are very similar, so it works great for reducing Umami installation time.
Comment #58
morbus iff@eiriksm pointed me here after I reported a 3 to 4s AJAX response within Commerce and its dynamic product variation field support within a Layout Builder layout. After applying the patch in #55, those same responses are now 1 to 1.2s. I don't know the innards enough to provide a code review, but from a UX perspective, this is a win for me.
Comment #59
tim.plunkettThe patch is still good, and the test does what it needs to do. Thanks!
Comment #61
josephdpurcell commentedYay RTBC!
I want to add more anecdotal evidence that the patch from #44 works exceptionally well. On Acquia, the longest profiled requests on PROD went from 38 sec before the patch to just 5 sec after. On DEV env, comparing uncached response time for a given URL before and after the patch showed an elimination of 15 million function calls and a 75% improvement in performance!
Thank you EVERYONE who helped make this patch happen!!!
Comment #62
larowlanComment #63
larowlanCommitted 57aabd2 and pushed to 9.0.x. Thanks!
c/p to 8.8, 8.9
Flagging for backport to 8.7
Comment #64
larowlanQueued a test on 8.7.x of previous patch
Comment #67
larowlanpassed on 8.7 too
backported to 8.7.x
Comment #69
xjmBelatedly promoting to critical; pretty sure it meets the criteria for a performance critical.
Comment #71
Shishir Kumar commented@tim.plunkett Layout builder is taking 50+sec to load. Please refer to attached xhprof test screenshots
Comment #72
Shishir Kumar commentedComment #73
andypostPlease file new issue instead of changing fixed ones