Hello,
I have a very simple JSON file that contains 5 fields that I need to chart using Views Json Query Plugin - 7.x-1.0+1-dev as data for Charts - 7.x-2.0-rc1+5-dev.
I can create a view of type JSON, and submit the JSON file URL and APath properly in Query settings.
- The data is properly read as I can display it in Tables or HTML List.
Using Charts (with either Google or HighCharts) only the first field is returned.
Ostensibly I would like to display all fields as data for a pie chart.
... or I could be happy with multiple "views" that display unique gauges?
(Gauges don't seem to exist as a choice in the Highlight integration library)
My JSON file looks like this:
[{"western_district_rating":193,"central_district_rating":0,"eastern_district_rating":14,"rating_date":1424285941,"error":0}]
Thanks



Comments
Comment #1
Pierre.Vriens commentedInteresting request, I've been asking myself also how to use JSON for the chart data. So far I haven't been able to find the answer to that myself.
Have you looked at the (new) documentation about Steps to create charts using the views UI? It includes a "Bonus tip" like You may find it easier to start with a "Table" display and convert it to a chart display after setting up the data. It can be easier to visualize what the result of the chart will be if it's been laid out in a table first.. But from what you are saying it appears that you have a table already, but still that's not enough to correctly create the related chart. Not sure yet what might be the reason for that. Anybody any suggestions for furher debugging what might be needed to get it to work?
Just a wild guess: that 1424285941 value in it seems like what might have to do with it. Can you do another experiment without that specific value included, and to verify what happens then?
Regarding Gauge charts: please refer to #2269817-3: Support for gauge charts.
Comment #2
fgjohnson@lojoh.ca commentedHi,
It seems something isn't consistent in how JSON data is read.
I am not a dev... so can only report what I see.
The above string I was sending, while being made up of 5 fields is one record.
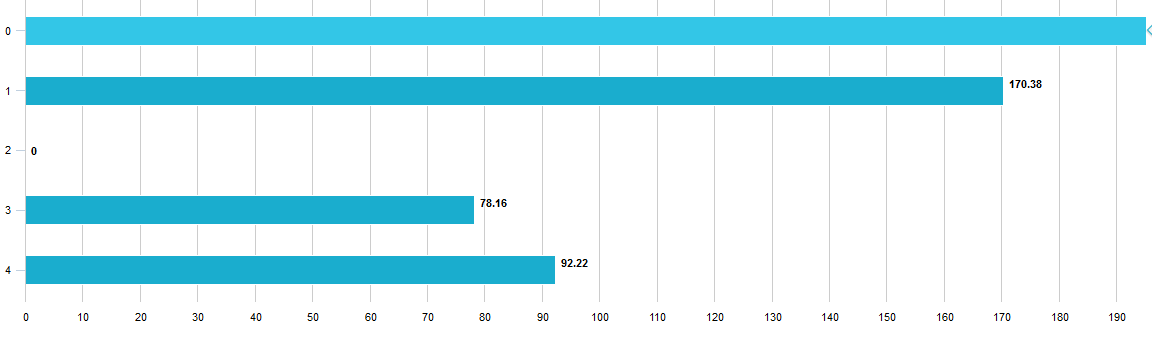
- Trying a Pie Chart only the last label/data pair seemed to be returned.
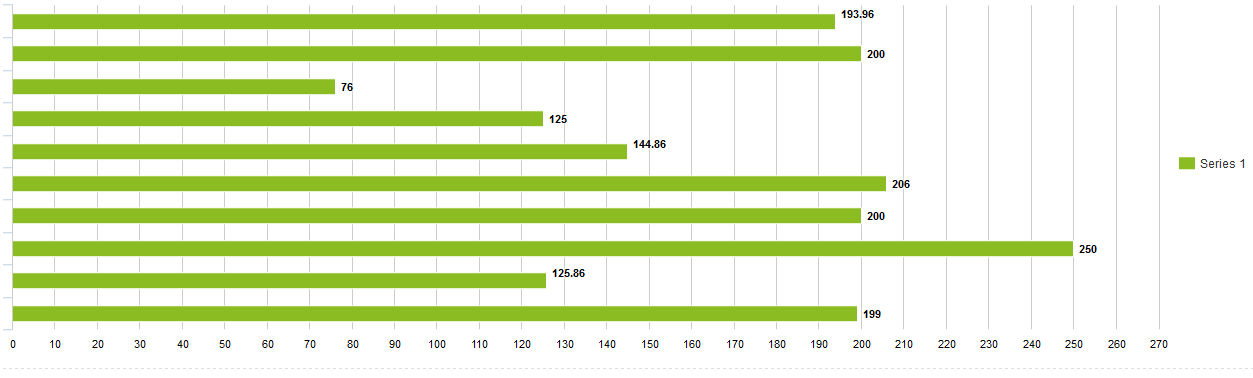
- Trying a bar/column all the values as bars (in one color only)are returned, but only the last "label" from the pairs appears in the legend/hover.
Odd because in "Chart settings" the field names are correct and getting assigned different colors.
So... it seems that the format of the source data is important.... not just any JSON will do! :-)
I altered my source data:
{"data":[{"type":"western_district_rating","value":"193.96"},{"type":"central_district_rating","value":"76"},{"type":"eastern_district_rating","value":"144.86"},{"type":"other_rating_1","value":"200"},{"type":"other_rating_2","value":"125.86"}]}
Pie Chart works fine...
Bar Charts display data but all bars/columns are the same color.
In addition it's not grouping data.
I added an extra value into each record...{"type":"western_district_rating","value1":"193.96","value2":"200"}
The Bar chart just plotted all value1's then value2's as the same color.
I expected value1 and value2 to be grouped with the Type field, not in order of the arrays.
value1:0
value1:1
value1:2
value1:3
value2:0
value2:1
value2:2
value2:3
(Does this make sense?)
Too bad re gauges...
Comment #3
fgjohnson@lojoh.ca commentedComment #4
fgjohnson@lojoh.ca commentedBTW Pierre,
I used the Views Json Query Plugin module and defined my JSON file in the query settings of the View editor.
Comment #5
fgjohnson@lojoh.ca commentedOur standard JSON strings come in a format where data records contain the labels...
ie a string that includes fieldname1:value1,fieldname2:value2, fieldname3:value3, etc...
How do I set the Query settings/apath so this format is recognized.
I don't want to rewrite all our JSON outputs.
Thanks
Comment #6
fgjohnson@lojoh.ca commentedAh Ha, My Bad...
In the settings of the chart there is a check box for Contains Labels....
This is the X-Axis!
And it seems that data can be one field only.... for Pie AND others..
Now looking for a way to chart multiple columns on the same chart.
Comment #7
Pierre.Vriens commentedGrant, while you've been making progress on this issue, I made some similar JSON-related progress via issue #2362855: Details about forena's JSON fmt to use it as chart(s) input. Near the end of it there is something with the chart (not charts) module, but the charts module is going to be similar. Note that over there it's about using the API in the end (not yet the vieuws integration like your issue).
Would you mind explaining a bit further what you mean with that 'In the settings of the chart there is a check box for Contains Labels.... This is the X-Axis!' in your last comment?
FYI: to find the answer to your last question, I'd suggest you review the
Steps to create charts using the views UI (and let us know if that answered that question).
Comment #8
fgjohnson@lojoh.ca commentedSorry...
It's actually a radio Button.
It seems that if the JSON is a series of records (second code block) containing labels and values things work fine. Self evident once discovered.
Data in a more traditional format seems to work.
Unfortunately my current data is in one record. Charts seems to have trouble with this format.
[{"western_district_rating":193,"central_district_rating":76,"eastern_district_rating":144.86,"rating_date":1424285941,"error":0}]Comment #9
Pierre.Vriens commentedI've been doing some more research about JSON. For now I'm going to "dump" in this extra comment a few things I found out about JSON, and some sample JSON file for somebody who is fairly new to JSON (like I am, sorry)... at the risk that everybody reading this comment know all this already of course ... Here I go ...
JSON is a text-based open standard. It is human-readable and used for data interchange between applications. JSON is derived from the JavaScript scripting language for representing simple data structures and associative arrays, called objects. Despite its relationship to JavaScript, it is language-independent, with parsers available for many languages.
To illustrate the content of a JSON file, consider some data about some user accounts. For each user, it includes these data:
This is what the (rather basic) JSON example might look like:
The above JSON example is fairly readable, and similar to a tabular format of 4 rows with 7 columns. The line breaks in it are optional, they were added here to enhance readability by humans. Columns for which no data are available, such as some of the Timezone data, are marked with "null". The "address" data, if provided (= not "null"), consists of 4 sub-columns.
The JSON filename extension is .json. The JSON format is often used for serializing and transmitting structured data over a network connection. It is used primarily to transmit data between a server and web application, serving as an alternative to XML.
JSON syntax is a basis of YAML version 1.2, which brings YAML "into compliance with JSON as an official subset";
Voilà, this should help as some kind of intro-to-JSON ... Some day it should be include in the docu somewhere also.
PS 1: haven't figured out what exactly these surrounding "[" and "]" chars are supposed to be, sometimes they are added, sometimes they are not. Anybody willing to teach me about when to yes or no include them?
PS 2: not exactly related to this specific question, but I ran into another JSON related "issue" about how to specify operators in JSON query strings ... It also includes links to these 2 (great I think) modules:
Comment #10
fgjohnson@lojoh.ca commentedI'll add to your dump. :-)
When setting up the Query Settings for a JSON view a couple of things are used.
xPathto the dataIn your example the Apath
xPathcan be left blank (or maybe use "[") and the Key (fieldname) is used display the data value: fields.In the below example the aPath
xPathis /data (I know it strips the "/" but I put it in for my own benefit.)In any one JSON there can be multiple Apaths
xPathand Keys.Below I can access the "time" data by using an Apath
xPathof "time" and a Key of Update Time.Comment #11
kopeboyI just tried this and it's not working: got an infinite stream of errors, see issue: https://www.drupal.org/project/charts/issues/3357984
Comment #12
andileco commentedWith Drupal 7 having reached EOL, I am closing all D7 tickets that do not have a patch.