
This project is not covered by Drupal’s security advisory policy.
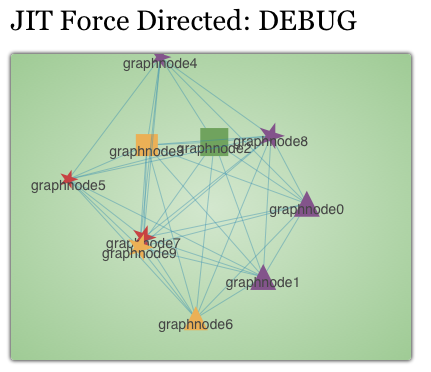
The JIT (Javascript InfoVis Toolkit) module provides integration with the Javascript InfoVis Toolkit (http://thejit.org) and Drupal. The JIT is a javascript information visualization library that enables interactive visualizations of data using only html, css and javascript.
7.x
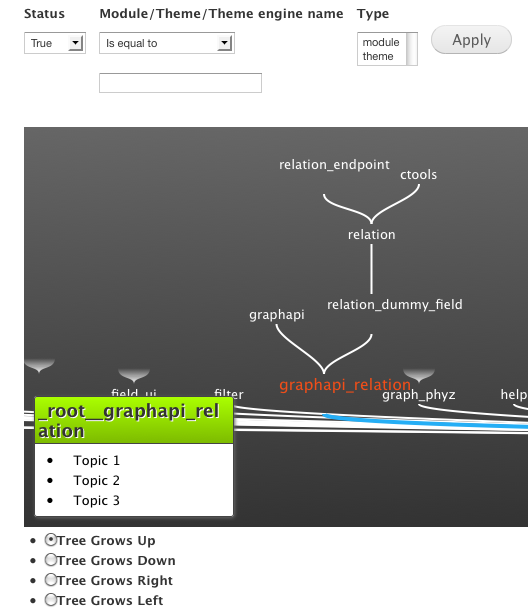
The 7.x version is useful for site builder when installing graphapi which provides views integration.
See the screenshots which are from the 7.x version
6.x
This module is indended for other module developers. This module implements the JIT javascript library allowing other module developers to provide users with visualizations of nodes, users, taxonomy data or really any data that they want to visualize.
Features provided
This module also adds some additional features on top of the JIT library to allow users a simple way to add common features to JIT visualizations, such as:
- custom searching of nodes in the visualization (not necessarily Drupal nodes)
- full screen mode
- easy configuration of visualization options
- javascript hooks for custom behaviors
- easy css skinnability of visualization for custom look and feel
- context windows for nodes
A demonstration of the JIT module (D6 version) is available here: http://aci-dev.tacc.utexas.edu/mrhanlon/thejit/
The JIT module grew out of the My-Plant.org project. The module can be seen in production at http://my-plant.org.
The Drupal 6 version of the JIT module was funded by the iPlant Collaborative.
Project information
- Module categories: Developer Tools, Integrations
 12 sites report using this module
- Created by mrhanlon on , updated
 This project is not covered by the security advisory policy.
Use at your own risk! It may have publicly disclosed vulnerabilities.


