Closed (fixed)
Project:
Open Flash Chart API
Version:
6.x-3.x-dev
Component:
User interface
Priority:
Normal
Category:
Support request
Assigned:
Unassigned
Reporter:
Created:
30 Sep 2009 at 16:17 UTC
Updated:
15 Oct 2009 at 14:30 UTC


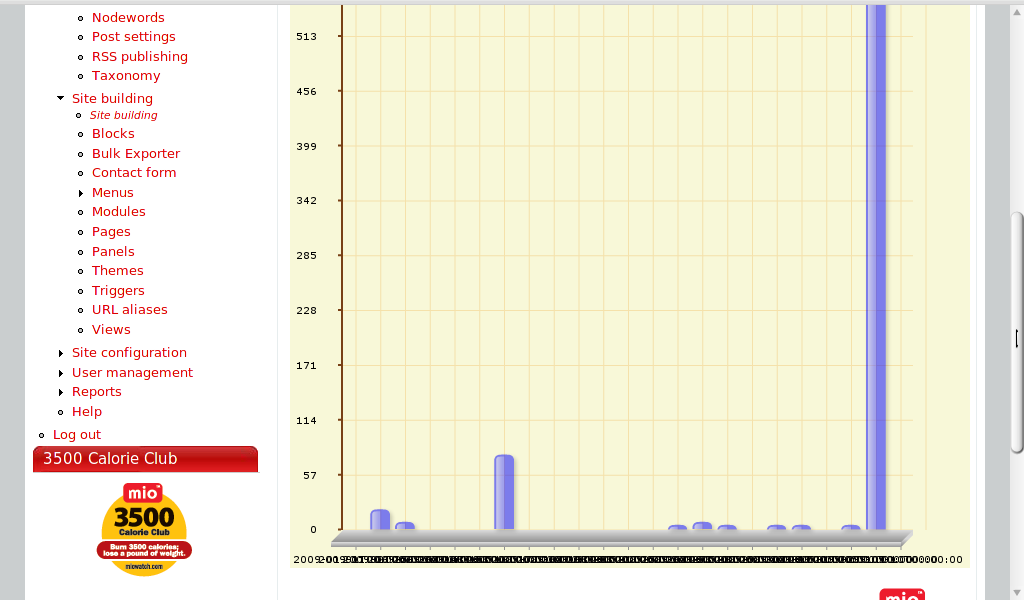
I'm graphing data (y) against dates (x) and the labels for the dates get all jumbled and unreadable when there are more than about 4 items to graph. (see example). Not sure just where/how is best addressed.
thnx!
| Comment | File | Size | Author |
|---|---|---|---|
| jumbled-dates.png | 52.31 KB | humble |

Comments
Comment #1
humble commentedComment #2
jvandervort commentedI'd shrink the font and/or change the label orientation.
vertical
$g->set_x_label_style( 10, '#9933CC', 1 );
or 45 degree
$g->set_x_label_style( 10, '#9933CC', 2 );
Comment #3
jvandervort commentedThe above is for ofc 1.x.
ofc 2.x uses
set_size();
set_vertical();