
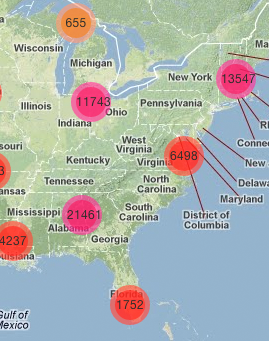


Server-side clustering for mapping in Drupal 7 based on Geohash: Geocluster increases performance of data-heavy map visualizations by clustering results on the server-side.
Client-side JavaScript libraries like Leaflet Markercluster enhance performance and readability of data-heavy maps by clustering points. But still, all data needs to be rendered by Drupal, transferred to the client and processed on a potentially slower end user device. By clustering data on the server-side, the load is shifted from the client to the server which allows displaying larger amounts of data in a performant way.
Read my Geocluster master thesis.
Usage
Geocluster relies on Geofield for the storing spatial data and Views for querying the data. Integration has been developed for the Leaflet, Views GeoJSON and Leaflet GeoJSON modules.
1. Install Geocluster and update existing content
ImportantFor D7: Re-save any previously created content using node_save or Views Bulk Operations, so that the Geocluster index is updated. If your field is named 'field_coordinates', you can check that in the table 'node__field_coordinates', you properly have values for column 'field_coordinates_geocluster_index_1'
For D8: navigate to admin/config/geocluster to generate the geocluster indexes
2. Create a clustered GeoJSON Feed
- Create a display based on Views GeoJSON
- Add the Geofield and exlude it from display
- Enable Geocluster in the Format Settings of your View
- Add Geocluster fields for aggregates of latitude, longitude, count
- Use Geocluster lat, lon as data source in the Views GeoJSON format settings
- Make sure that no additional fields are used for aggregation, you can still use them with aggregate functions like GROUP_CONCAT
- You maybe want to save this step until everything else works: set the item limit to 0 so that all your content will get clustered
Note that Views GeoJSON is the obvious example, you can also use other display formats for representing clustered data.
3. Create a map that shows the clustered data
Use Leaflet GeoJSON Bean to create a map based on the clustered GeoJSON feed at block/add. This use case has been tested, you might be able to use any JavaScript mapping library with a GeoJSON bounding box to render the clustered results.
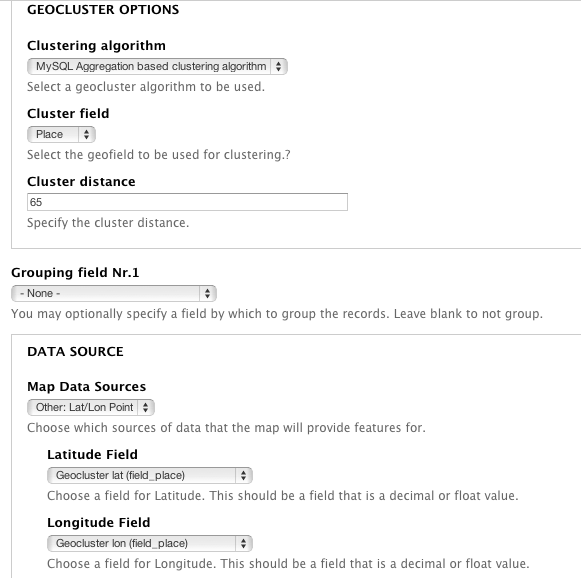
The configuration should look similar to this example, also refer to the Demo feature.
For Apache Solr: enable geocluster_solr, create a Geocluster Solr server + index where you index the Geofield, latitude & longitude values and Geocluster index fields and create a Search API View based on that index.
Algorithm options
- The PHP based clustering algorithm is for testing purposes only and scales up to 1,000 items.
- The MySQL Aggregation based clustering algorithm scales up to 100,000 items.
- The Search API Solr based clustering algorithm scales beyond 1,000,000 items using Search API Solr.
See a visual comparison of the different algorithms.
How geocluster works
Spatial index based on Geohash
Geocluster adds a hierarchical, spatial index to geofields based on Geohash. Every geofield geographic point coordinate gets encoded into a string identifier. Every character of the geohash divides space into sub-quadrants. For each geohash identifier, all its substring-prefixes from 1 to n length are stored separately. This creates an index, upon which the clustering algorithm can then be performed.
Cluster points on request
A server-side clustering task is issued when the data for a map is requested. It is recommended using the bounding box strategy of a Javascript mapping library like Leaflet or OpenLayers, as it will request the location data asynchronously by fetching a GeoJSON feed. See the Views GeoJSON and Leaflet GeoJSON modules.
The clustering algorithm
- determine the geohash index level to cluster on, based on the bounding box size, current zoom level and configured cluster distance
- dynamically cluster (aggregate) all points within cells that share a common prefix at the calculated index level
- check for overlaps at the edges of each cluster cell and merge clusters if appropriate
Return clustered results
The clustered results are returned. The provided Leaflet integration visualizes clusters and provides appropriate interactions: a click on clustered results will zoom-in whereas normal results are attached the default popup behavior.
See #1807358: Drupal Mapping Diagrams for a visual explanation on what's going on.
Resources
Related
- Leaflet Markercluster is a JavaScript based, client-side solution
- Geoclustering is a server-side Drupal 6 solution
- Openlayers Quick Query - related Drupal 7 sandbox project
- Blog post on Leaflet maps with Drupal based on a (more efficient) custom database query
Websites using geocluster
Please contact a maintainer if you have other examples to provide
Project information
 Seeking co-maintainer(s)
Maintainers are looking for help reviewing issues.- Maintenance fixes only
Considered feature-complete by its maintainers. - Module categories: Site Structure, Performance
 66 sites report using this module
- Created by dasjo on , updated
 Stable releases for this project are covered by the security advisory policy.
There are currently no supported stable releases.
Releases
7.x-1.0-beta2
released 14 May 2013
Works with Drupal: 7.x
Development version: 7.x-1.x-dev updated 7 Nov 2019 at 13:13 UTC


