
Closed (fixed)
Project:
Charts
Version:
8.x-3.x-dev
Component:
Chart.js Integration
Priority:
Normal
Category:
Feature request
Assigned:
Unassigned
Issue tags:
Reporter:
Created:
5 Dec 2018 at 01:00 UTC
Updated:
12 Dec 2019 at 05:39 UTC
Jump to comment: Most recent, Most recent file


Comments
Comment #2
andileco commentedYou'd need to
1) add to/patch one of the classes here (https://cgit.drupalcode.org/charts/tree/modules/charts_chartjs/src/Setti...) or create a new one, and
2) use the override feature, as described here: https://cgit.drupalcode.org/charts/tree/starterkits/charts_overrides/REA...
This is how the module currently keeps a pretty minimal settings form that (mostly) works for all the charting libraries while still giving room for all the options provided by the respective APIs.
Please let me know if this helps!
Comment #3
visualsbysina commentedHello, I'm having the same exact problem, and after following the instructions you provided I have not been able to get any options to pass into chartjs. I tried the starterkit method extensively to no luck. I even tried overriding the chartjs library to bypass the module and pass my options directly, but I can't get anything to show up. Any help would be greatly appreciated. It seems that I can't modify the chart at all, only barely through the views interface.
Comment #4
andileco commentedI'd be glad to try to help. Can you include some of the code you've used?
Comment #5
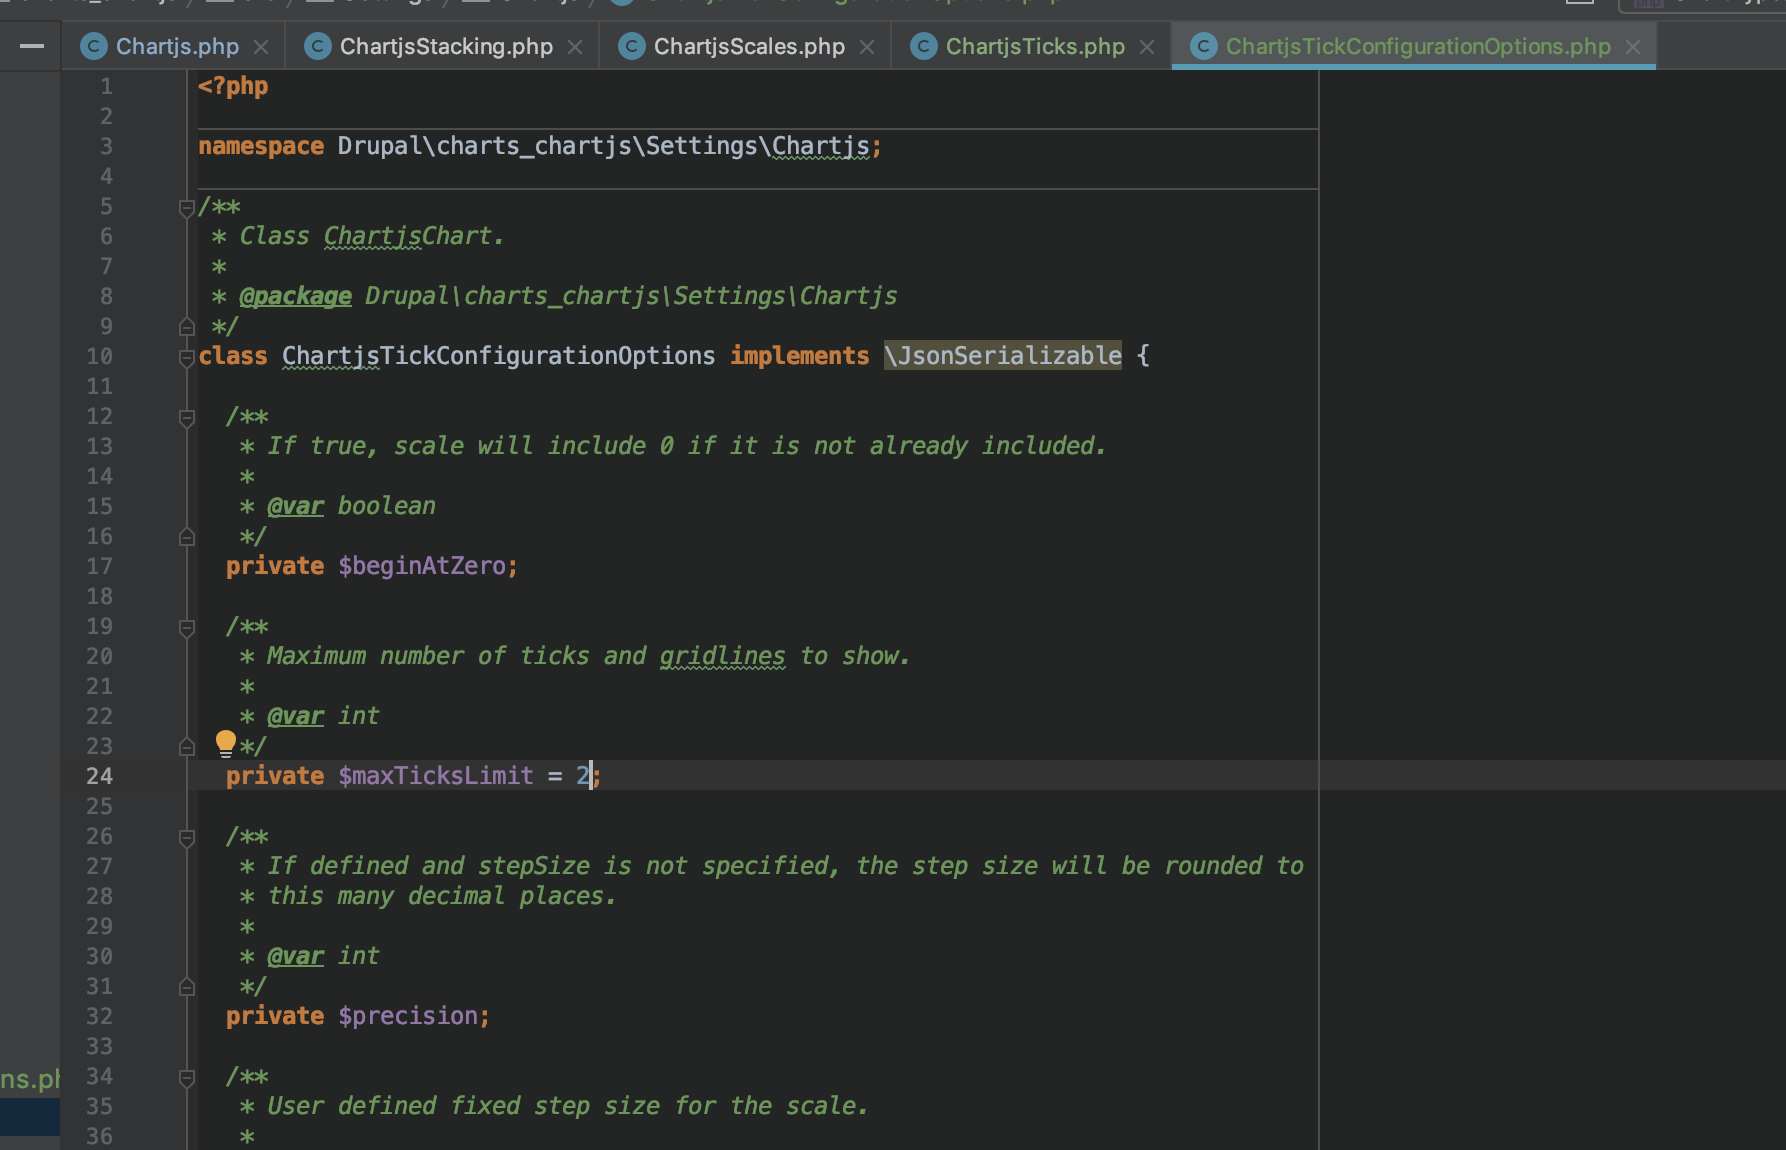
andileco commentedOK, I took a better look at this. Please try this patch. I wrote it for 8.x-4.x, but I think it will still apply on 3.x. Let me know if what I did in this patch makes sense. I tested the patch by modifying line 24 of the new file, ChartjsTickConfigurationOptions.php, to 2, and I saw that the number of ticks reduced to 2.
Comment #6
andileco commentedUploading screenshots so you can see. If this works for you, I'll plan to commit. What you require may require at least an additional patch, which I'd be happy to apply.
Before:

Change to 2 in IDE:

After:

Comment #7
andileco commentedAfter applying the patch in #5, I could replicate what you see in #6 with changing ChartsOverridesChartjs.php to:
Comment #8
visualsbysina commentedWow, thank you so much Andileco! I was out yesterday and was just about to post what we tried, but I will give your new updates a try first! Many thanks! Also, Nick G and Stan A say hello!
Comment #9
andileco commentedHi, y'all! Looking forward to hearing more.
Comment #11
andileco commentedWent ahead and added the patch