

Closed (fixed)
Project:
Charts
Version:
8.x-3.x-dev
Component:
Highcharts integration
Priority:
Normal
Category:
Feature request
Assigned:
Unassigned
Reporter:
Created:
12 Feb 2018 at 10:51 UTC
Updated:
13 Feb 2018 at 00:53 UTC
Jump to comment: Most recent, Most recent file



Comments
Comment #2
john cook commentedI've created a patch to allow this functionality. Currently it works when used as an API, but not when used with Views.
I added the following line to the example code to test:
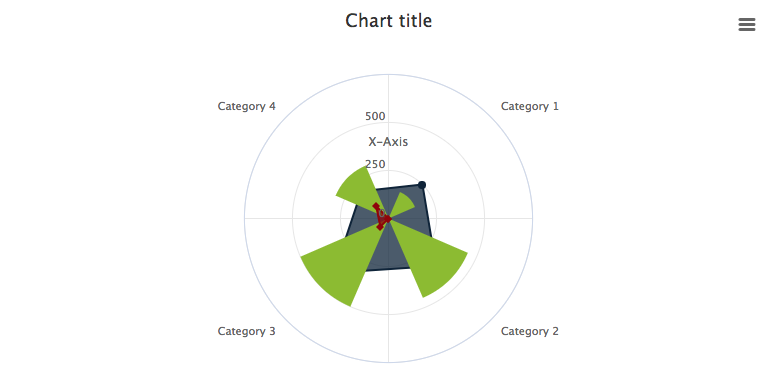
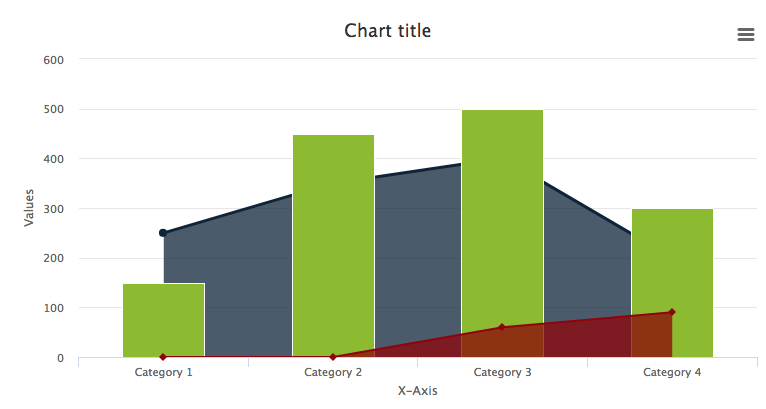
$options['polar'] = TRUE;Before the patch the area example using Highcharts looked like this:

And after the patch:

As Google Charts does not currently implement a polar coordinate system, the setting is ignored and the output looks like:

Comment #4
andileco commentedI went ahead and added Views/Blocks integration, which required small changes to the patch.
Comment #5
andileco commented