

Closed (won't fix)
Project:
Drupal core
Version:
8.1.x-dev
Component:
routing system
Priority:
Major
Category:
Task
Assigned:
Unassigned
Reporter:
Created:
14 Apr 2015 at 15:02 UTC
Updated:
2 Sep 2016 at 20:29 UTC
Jump to comment: Most recent, Most recent file




Comments
Comment #1
dawehner.
Comment #2
fabianx commentedComment #3
dawehnerI'll give it a quick try.
Comment #4
dawehnerQuick outline.
Comment #5
wim leersRoughly 1% per page load, so qualifying as at least major.
Comment #6
arla commentedClaiming.
Comment #7
arla commentedThe complete list of services is needed when building routes, so I followed the __constructor($service_ids) pattern in LazyRouteEnhancer and others.
I inspected only a few tests locally. ParamConverterManagerTest needed updating because of the dropped addConverter().
Let's see how many other things are broken by this!
Comment #9
wim leersLooks like good progress :) Please ping somebody if you're stuck on fixing the test failures!
Comment #10
arla commentedReimplementing the priority sorting that we lost by not relying on the service collector. (Wrong number in file names because reasons.)
Comment #11
arla commentedSorry, interdiff coming up.
Comment #12
arla commentedYay, green. But seems like I messed up when creating the patch, this one should be better.
Comment #13
almaudoh commentedRelated: #2428609: Refactor PathBasedBreadcrumbBuilder to not use AccessAwareRouter for building links
We will still continue to load paramconverters when building breadcrumbs (worse, other route enhancers as well) until we fix that.
Comment #14
wim leersLooks like this is making an API change.
Assigning to @dawehner for review.
Comment #15
dawehnerThis looks really great!
Nice helper method.
Comment #17
fabianx commentedWhy can't we use the service_collector pattern here?
--
Overall looks great, but I know Alex would probably ask this question (he did in a recent twig thing first also not using the service collector pattern).
Comment #18
fabianx commentedDiscussed with catch and dawehner, service collector pattern is the _source_ of the problem :-D.
So this can go in first and dawehner opened generic follow-up issue.
Comment #19
dawehner#2472337: Provide a lazy alternative to service collectors which just detects service IDs is the follow up described in #18
Comment #20
catchAgreed with doing this first, then adding the general approach later and converting, since there's no real API change in terms of contrib impact here.
One minor comment:
When would this happen? Does it need a comment?
Comment #21
alexpottLet's do this.
Comment #22
arla commentedThere are some other compiler pass classes that do the same. They do not have comments. I'm not sure when this can happen, but I'm guessing unit tests?
I'm completely new to profiling and measuring performance, but I wouldn't mind getting mind hands dirty with it if someone can give me some pointers.
Comment #23
dawehnerWell yeah, we have that kinda pattern in all the compiler passes, no idea why, to be honest.
Comment #24
arla commentedDid some profiling on patch #12.
xhprof diff before/after patch

For anonymous user on frontpage with 1 article.
Screenshot for
Container::get('paramconverter_manager'):Conclusion: We win 2.6 ms here because it doesn't get() the 5 paramconverter services.
Response time average
200 requests on head
Mean response time: 225.9 ms
200 requests with patch #12
Mean response time: 225.5 ms
Comment #25
arla commentedOops, previous numbers were with xdebug enabled.
xhprof diff

Same thing, except the difference is only 1.1 ms now that the whole thing is much faster.
Response time
600 requests
Head: 131.706 ms
Patch: 130.331 ms
I'm not sure the numbers are actually reliable, they both seems to take any amount between 130 and 133...
Comment #26
wim leersSo it looks like this needs more profiling, to confirm Arla's numbers, especially because the difference here seems to have a high standard deviation.
Comment #27
yesct commentedI am going to attempt to confirm the profiling.
Comment #28
yesct commentedI sat down with @Arla yesterday. (their raw numbers are faster than mine)
Re-running things today
I have one node.
Times are anonymous user on front page or node/1
Note that since #2226761: Change all default settings and config to fast/safe production values cache is on by default, so I
cp sites/example.settings.local.php sites/default/settings.local.php
uncommented the local settings line in settings.php
turned off blackfire and xhprof in my php.ini
head front
ab -n 2 http://localhost:8888/d8-project/d8/
(to hit it a couple times first)
then 200 times:
ab -n 200 http://localhost:8888/d8-project/d8/
Time per request:       547.479 [ms] (mean)

Connection Times (ms)
              min  mean[+/-sd] median   max
Connect:      533  547   9.5    546     600
Processing:     0    0   0.0      0       0
Waiting:        0    0   0.0      0       0
Total:        533  547   9.5    546     600
this patch front
ab -n 2 http://localhost:8888/d82-project/d82/
ab -n 200 http://localhost:8888/d82-project/d82/
Time per request:       538.960 [ms] (mean)

Connection Times (ms)
              min  mean[+/-sd] median   max
Connect:        0    1   7.2      0     101
Processing:   520  538   9.5    537     592
Waiting:      479  498   9.1    497     550
Total:        520  539  11.7    537     636
with patch is 1.56% faster
((538.960-547.479)*100/547.479)
head node/1
ab -n 2 http://localhost:8888/d8-project/d8/node/1
ab -n 200 http://localhost:8888/d8-project/d8/node/1
Time per request:       481.291 [ms] (mean)

Connection Times (ms)
              min  mean[+/-sd] median   max
Connect:        0    0   0.0      0       0
Processing:   465  481   9.8    480     533
Waiting:      430  446   9.4    444     498
Total:        465  481   9.8    480     533
patch node/1
ab -n 2 http://localhost:8888/d82-project/d82/node/1
ab -n 200 http://localhost:8888/d82-project/d82/node/1
Time per request:       478.621 [ms] (mean)

Connection Times (ms)
              min  mean[+/-sd] median   max
Connect:        0    0   0.0      0       0
Processing:   463  478   8.6    478     523
Waiting:      429  443   8.4    442     487
Total:        463  479   8.6    478     523
0.55% faster
100*(481.291- 478.621)/481.291
-------
xhprof
turn on xhprof in php.ini, still with the settings.local.php which has cache off
I did 10 runs, and picked the fastest one.
head frontpage
http://localhost:8888/d8-project/d8/?XHPROF_ENABLE=y
Total Incl. Wall Time (microsec): 669,268 microsecs
Parent/Child report for Drupal\Core\DependencyInjection\Container\prod\service_container_prod::getParamconverterManagerService [View Callgraph ]
8,404 microsecs
child function
Symfony\Component\DependencyInjection\Container::get@4 5 calls 45.5% 7,859 include wall time microsecs
patch frontpage
http://localhost:8888/d82-project/d82/?XHPROF_ENABLE=y
Total Incl. Wall Time (microsec): 670,445 microsecs
Parent/Child report for Drupal\Core\DependencyInjection\Container\prod\service_container_prod::getParamconverterManagerService [View Callgraph ]
380 microsecs
no child get calls
frontpage comparison
http://localhost:8888/xhprof/xhprof_html/?sort=ct&run1=553375bd581ff&run...

http://localhost:8888/xhprof/xhprof_html/?sort=ct&run1=553375bd581ff&run...

head node/1
http://localhost:8888/d8-project/d8/node/1/?XHPROF_ENABLE=y
Total Incl. Wall Time (microsec): 596,751 microsec
Parent/Child report for Drupal\Core\DependencyInjection\Container\prod\service_container_prod::getParamconverterManagerService [View Callgraph ]
8,619 microsecs
child function
Symfony\Component\DependencyInjection\Container::get@4 5 calls 45.5% 8,128 include wall time microsecs
patch node 1
http://localhost:8888/d82-project/d82/node/1/?XHPROF_ENABLE=y
Total Incl. Wall Time (microsec): 595,160 microsecs
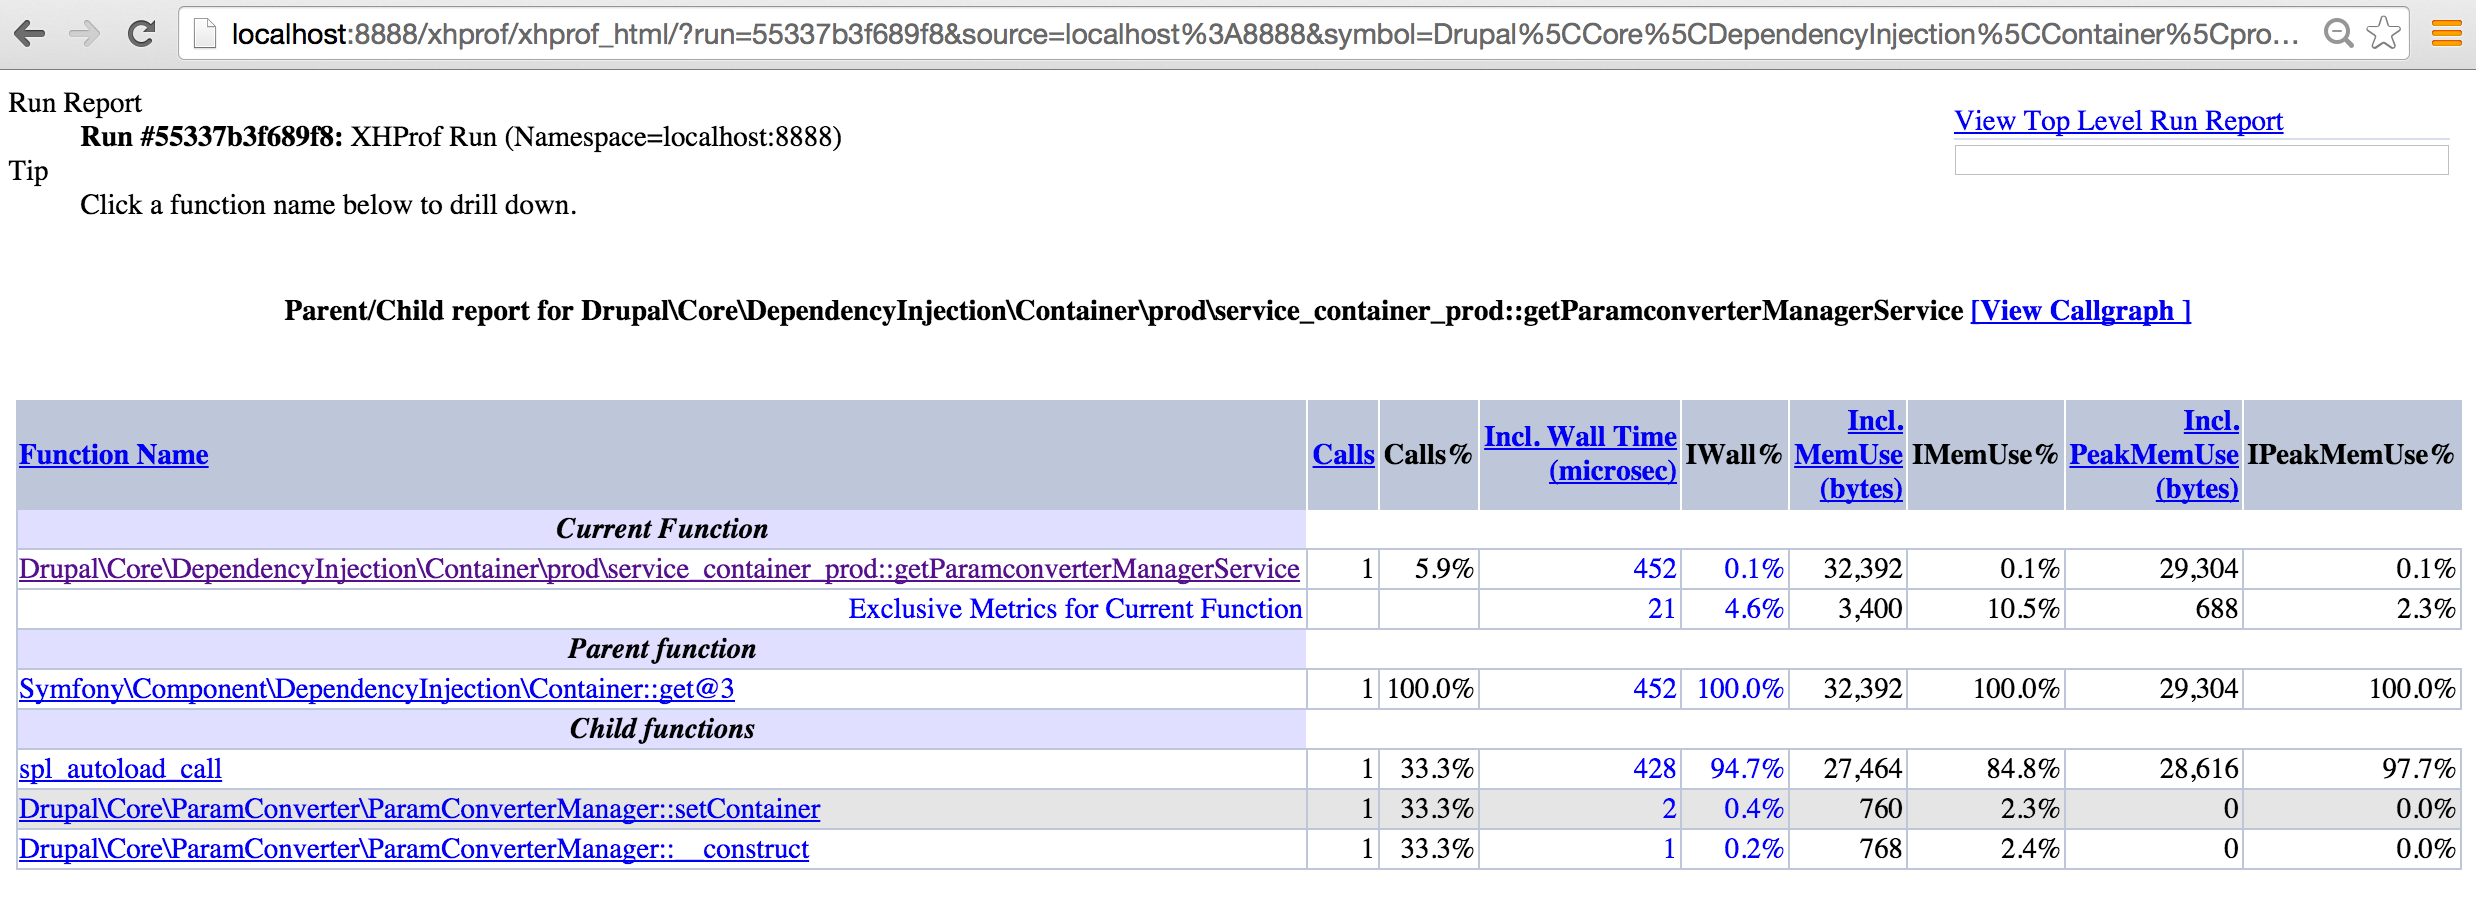
Parent/Child report for Drupal\Core\DependencyInjection\Container\prod\service_container_prod::getParamconverterManagerService [View Callgraph ]
452 microsecs
child function
no child get calls
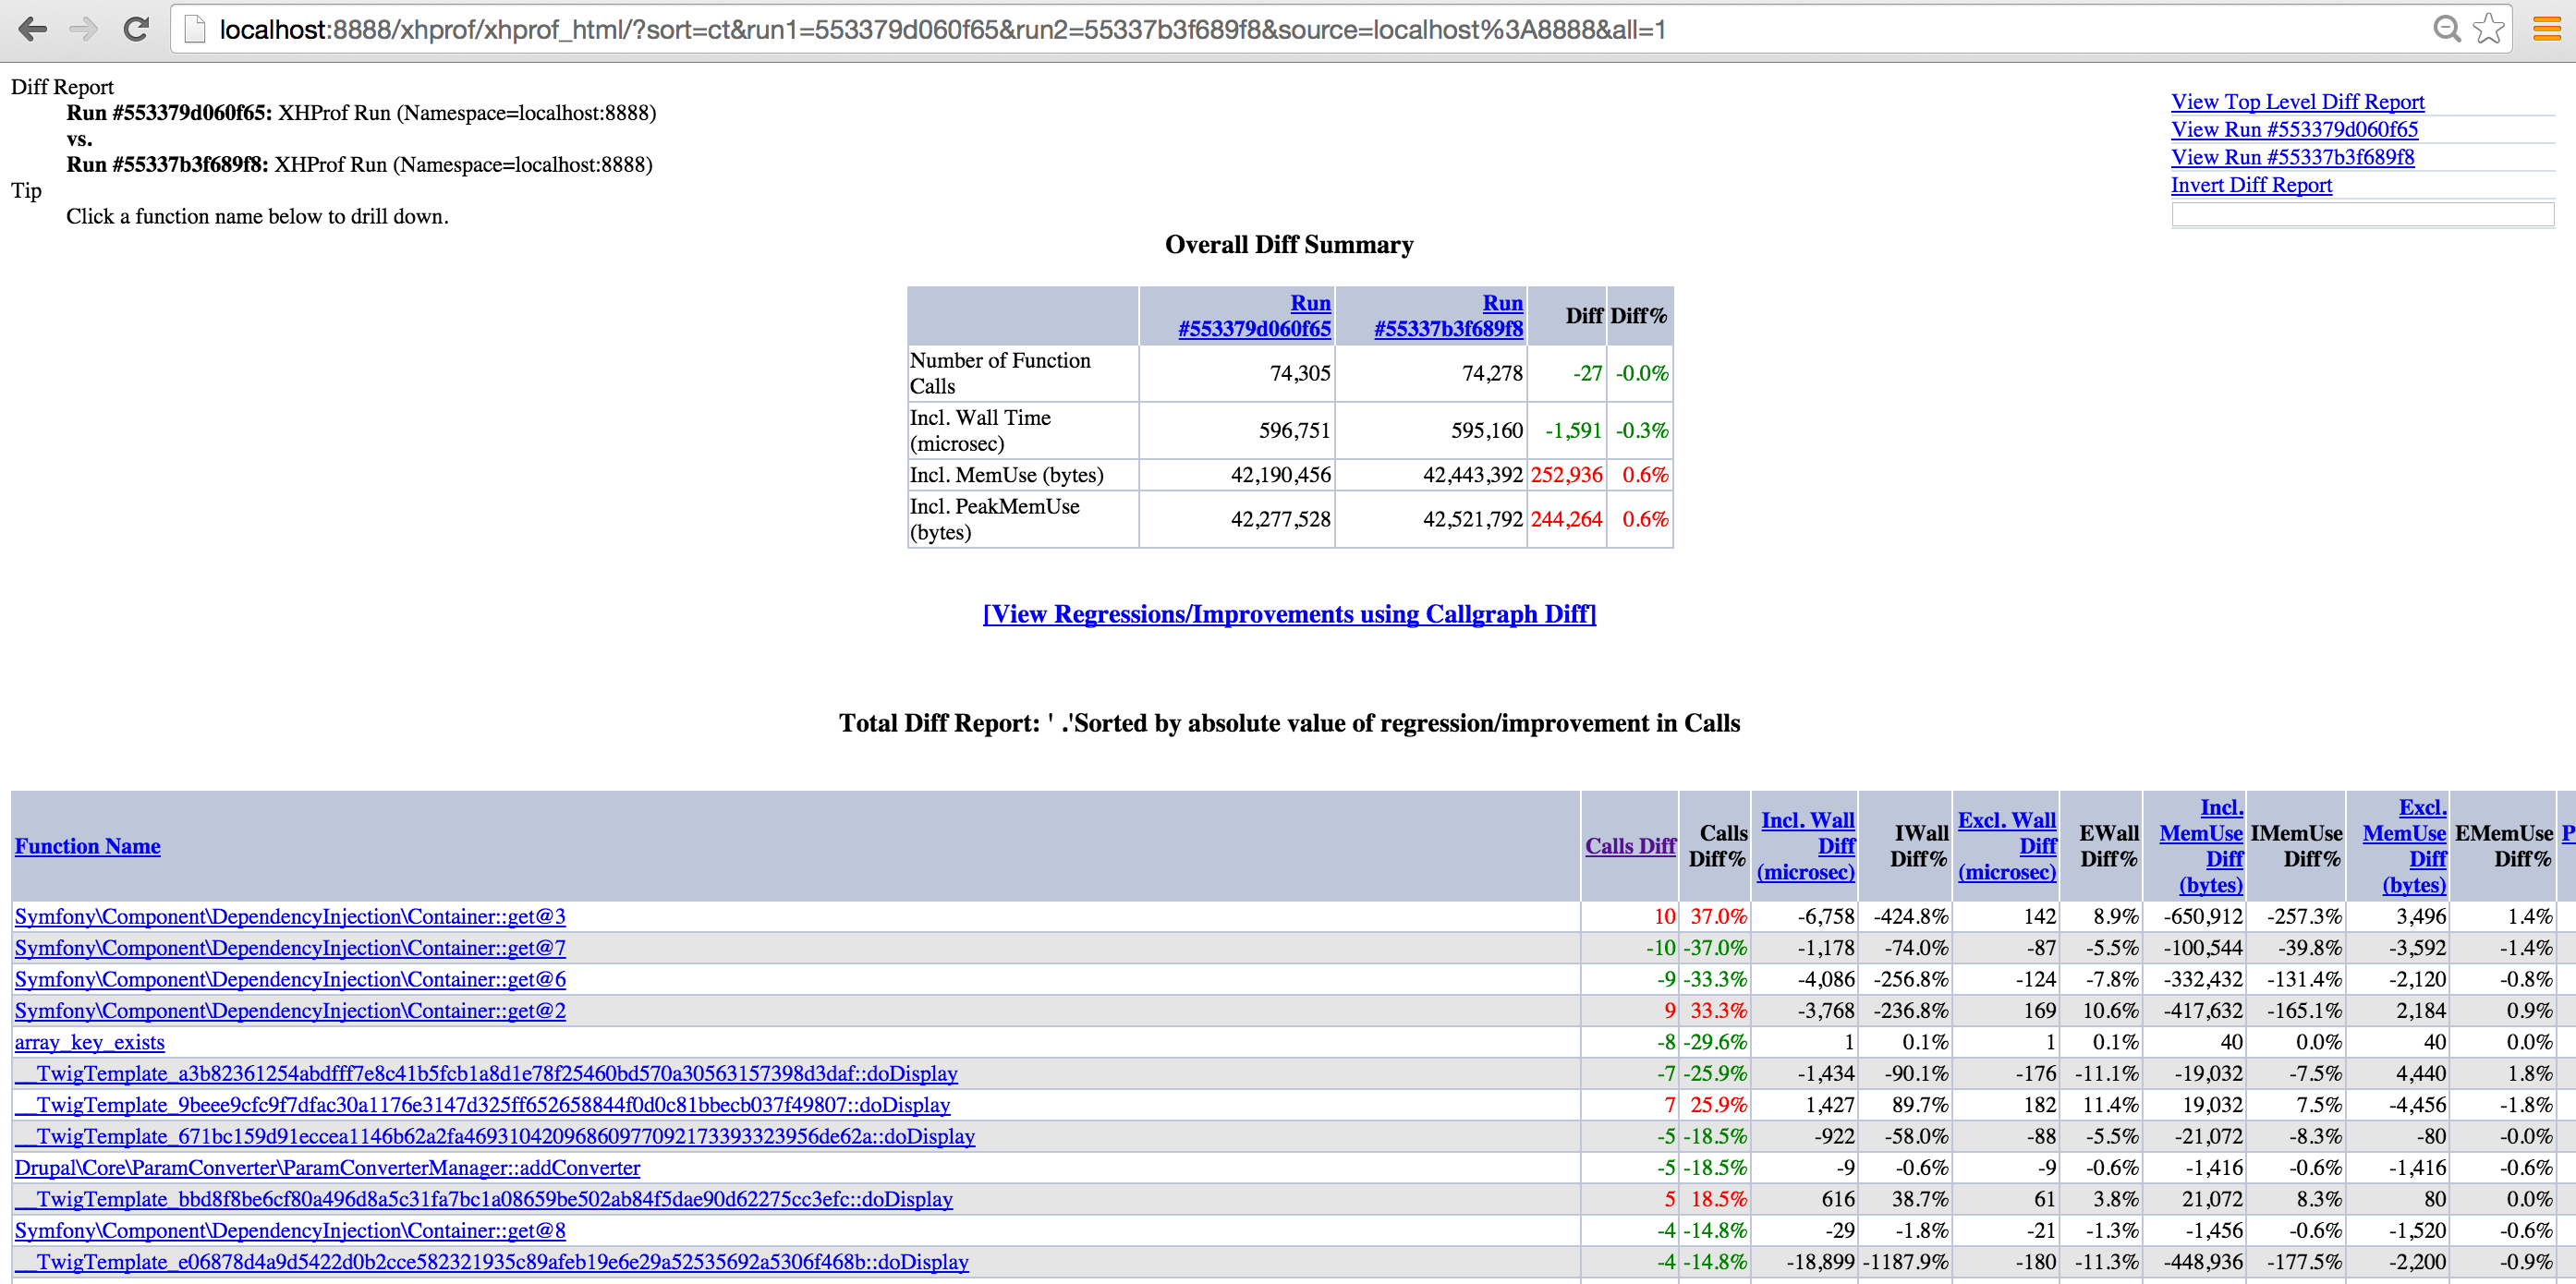
node 1 comparison of those two runs
http://localhost:8888/xhprof/xhprof_html/?sort=ct&run1=553379d060f65&run...

just get param converter
http://localhost:8888/xhprof/xhprof_html/?sort=ct&run1=553379d060f65&run...
just the get param con comparison

Drupal\Core\ParamConverter\ParamConverterManager::addConverter -5 calls -62.5% -9
Symfony\Component\DependencyInjection\Container::get@4 -5 calls -62.5% -8,128
Drupal\Core\ParamConverter\ParamConverterManager::setContainer 1 calls 12.5% 2
Drupal\Core\ParamConverter\ParamConverterManager::__construct 1 calls 12.5% 1
spl_autoload_call 0 0.0%
....
next maybe try to get xhprof-kit working to do better than: do 10 runs and pick the fastest of each set.
Comment #29
yesct commentedoops. forgot the comparison for frontpage. adding the file, and I will edit the previous comment to put them in.
Comment #30
yesct commentedfrom
https://github.com/LionsAd/xhprof-kit
run by
./xhprof-kit/benchmark-branches.sh 553384a75b4a7 baseline-8.0.x 8.0.x 2470926-12
Comment #34
dawehnerSo this made things actually worse MHH yeah that additional level of indirection is for sure not always perfect.
Comment #35
dawehnerI guess this is a won't fix now?
Comment #37
Crell commentedYes, let's.