 The
The Chart HowTos
HowTo pages are short, highly-targeted articles on how to accomplish a specific task. They are contributed by the community in response to a
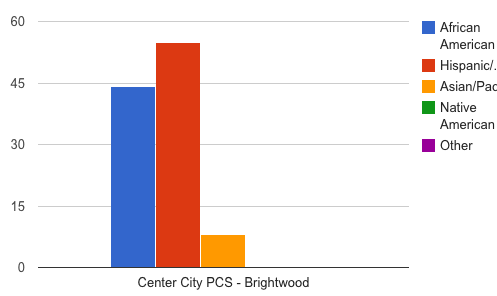
Chart previews
This documentation page contains some previews (screenshots) of all sorts of charts created with the Chart module.
Create charts using Views
Anybody familiar with the views UI can use the chart module to create charts without coding PHP snippets, as one typically does when using
Getting started
Dependencies
How to contribute
Despite the chart module being the most commonly used for creating charts in Drupal, it has a major challenge to be addressed: it requires a
Issue creation guidelines
This documentation page contains some guidelines for creating issues related to the Chart module.
Modules related to Chart
About this page
Usage statistics
As of Nov 2, 2014, 25.973 sites use the Chart module, which according to that measure:
Using the Chart API

