
 Come together with the global Drupal community in Rotterdam, 28 Sept – 1 Oct 2026. Sessions, contribution, connection, and Early Bird savings until 8 June.
This patch adds support for the colorAxis and datalessRegionColor options for the Google Charts GeoChart ('geo') chart type.
With this patch the colorAxis option can be used to set a custom range of colours for the map display. For example:
$options = [
'type' => 'geo',
'title' => $this->t('Chart title'),
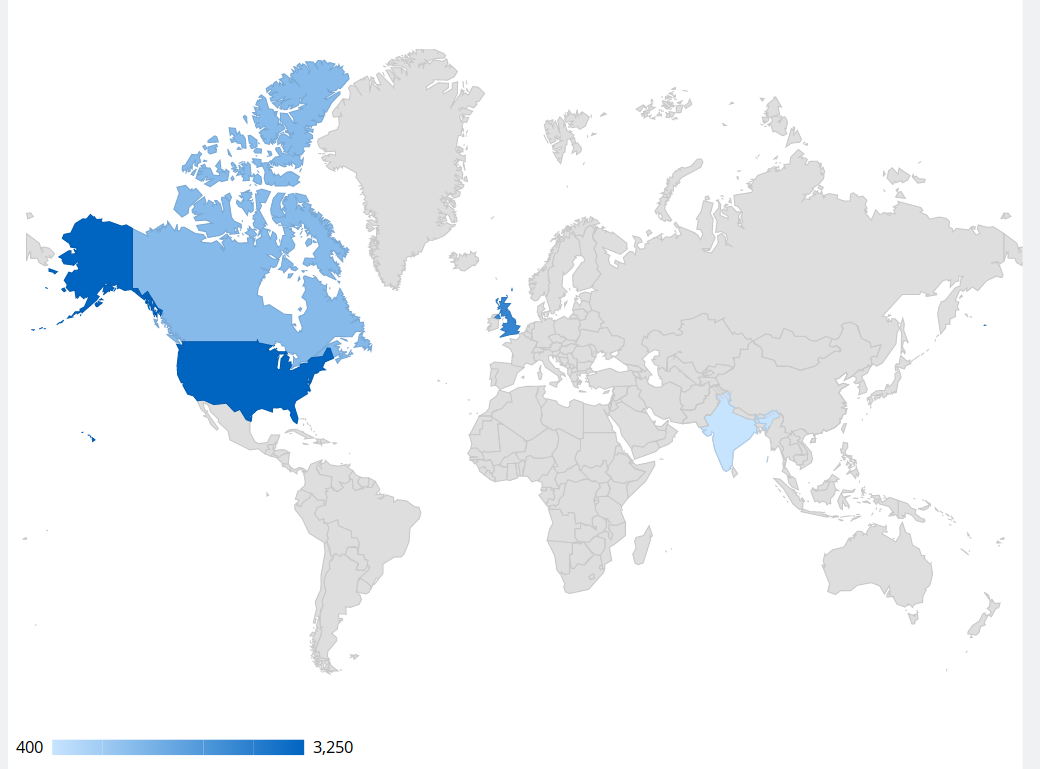
'colorAxis' => ['#c7e4ff', '#a0cbf3', '#77b1e6', '#5098da', '#287ece', '#0064c1'],
'datalessRegionColor' => '#dedede',
];
$categories = ['United States','United Kingdom', 'Canada', 'India'];
$seriesData[] = [
'name' => 'Users',
'data' => [3250, 2500, 1350, 400],
];
Results in this:
| Comment | File | Size | Author |
|---|---|---|---|
| #3 | geoChart-color-options--3086825-1.patch | 2.82 KB | megan_m |
| geoChart-color-options.patch | 2.8 KB | megan_m | |
| geoChart-Example2.png | 124.16 KB | megan_m |

Comments
Comment #2
megan_m commentedComment #3
megan_m commentedSmall change to prevent this from breaking other charts that don't include the colorAxis option.
Comment #5
andileco commentedThanks for the patch and the EXCELLENT issue write-up! I made two small changes that prevented a couple undefined index issues in the dblog when I tested with your code.
Comment #6
megan_m commentedComment #7
andileco commentedApplying this to 4.x (should have done this before).
Comment #9
andileco commented