
 Come together with the global Drupal community in Rotterdam, 28 Sept – 1 Oct 2026. Sessions, contribution, connection, and Early Bird savings until 8 June.
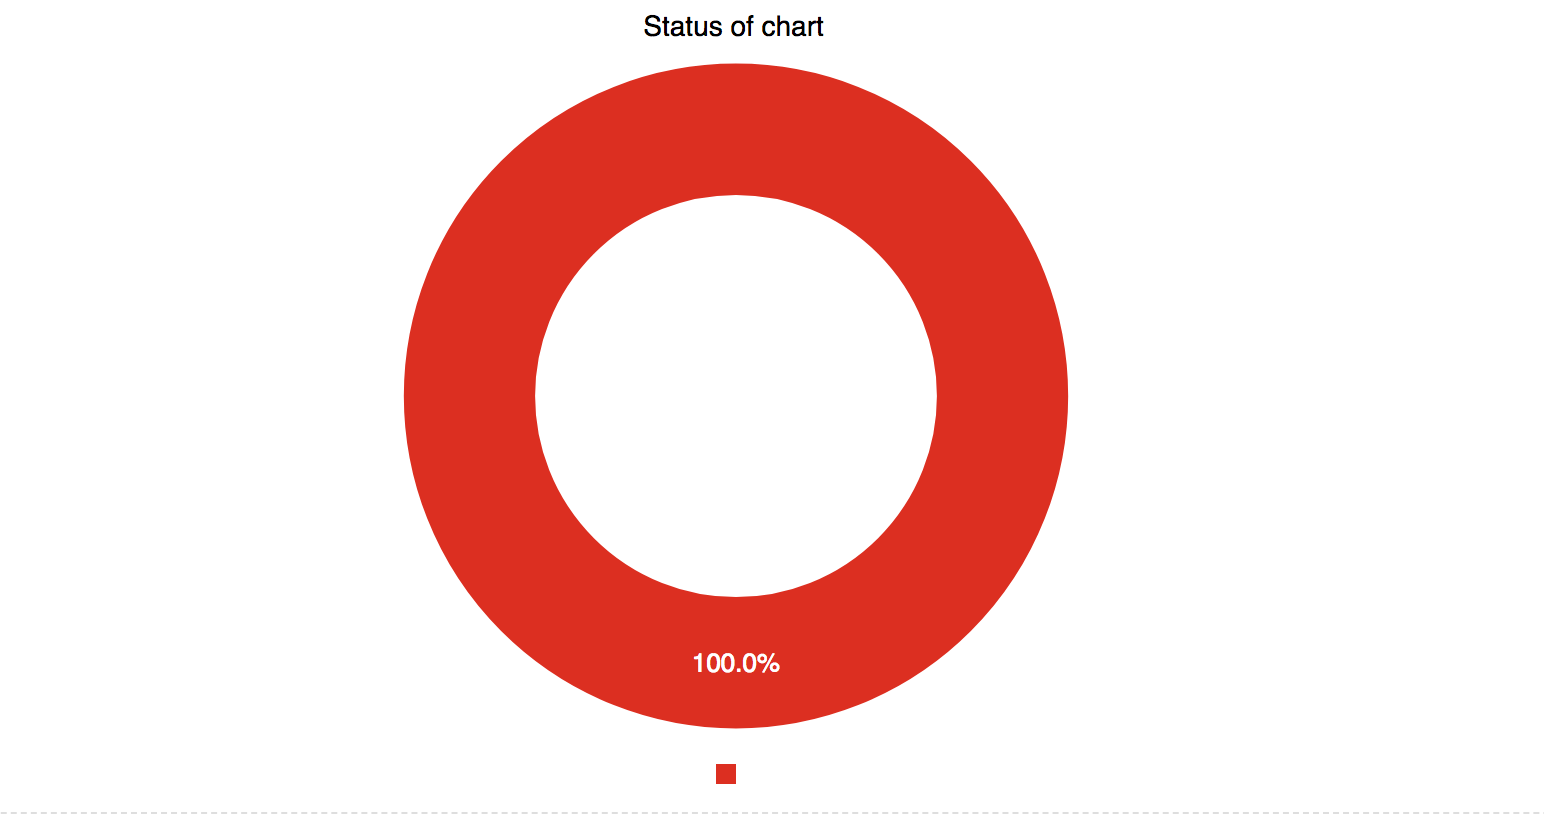
Hello. When I trying to display my chart using a donut chart using C3 Charts, the Chart shows a single value and no labels. Select Google Charts the display is a single value.
Views results


| Comment | File | Size | Author |
|---|---|---|---|
| #6 | Screen Shot 2018-02-24 at 9.24.40.png | 273.71 KB | zinalacina |
| #6 | Screen Shot 2018-02-24 at 9.14.58.png | 102.09 KB | zinalacina |
| #5 | Screenshot_20180223-164816.png | 224.84 KB | andileco |
| #3 | Screen Shot 2018-02-23 at 9.24.13 AM.png | 94.89 KB | andileco |
| Screen Shot 2018-02-23 at 16.59.38.png | 24.83 KB | zinalacina |

Comments
Comment #2
andileco commentedThanks for reporting. This was fixed at some point, so I'll look to see where the regression occurred.
Comment #3
andileco commentedOK, adding some notes:
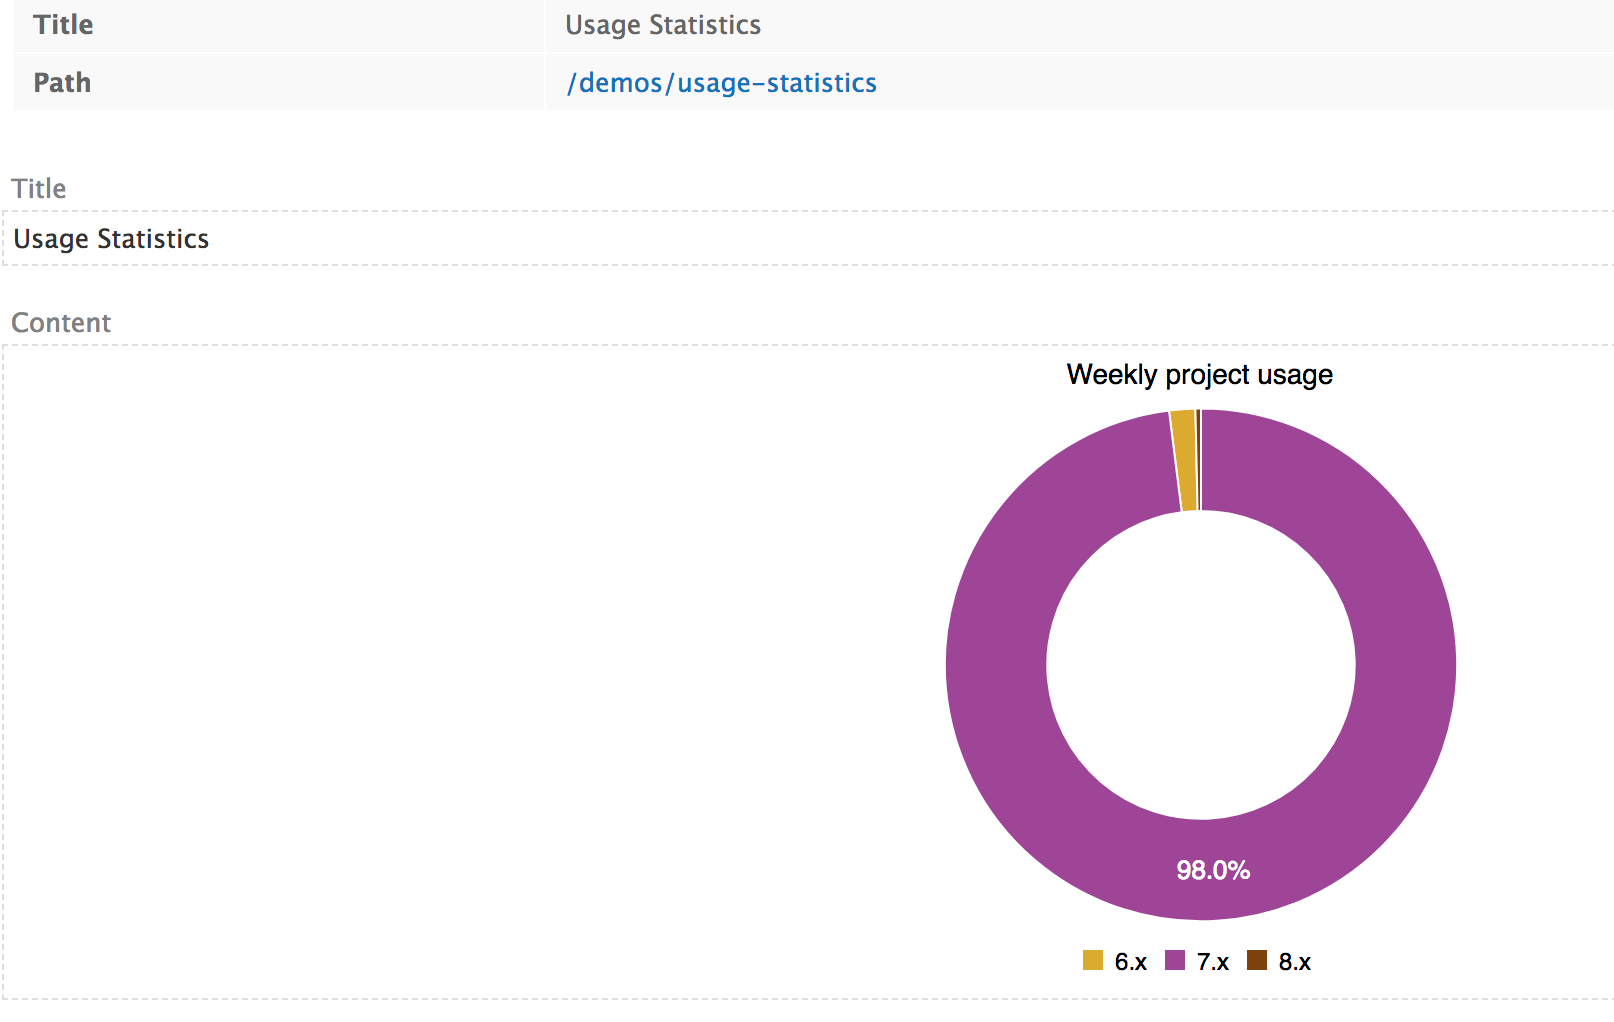
1) When more than one data field is selected, C3 does create a donut properly (see attached), but Google does not
2) When one data field is used, C3 does not create a donut properly (see image from post #1), but Google does
Comment #4
zinalacina commented@andileco Thank you very much.
What you mean by more than one data field is selected??
Please, can I see the screenshot of the of your view chart setting ?
chart setting of this one
Comment #5
andileco commentedOK, attached. Away from my computer, so this is the view from mobile.
Comment #6
zinalacina commentedThank,
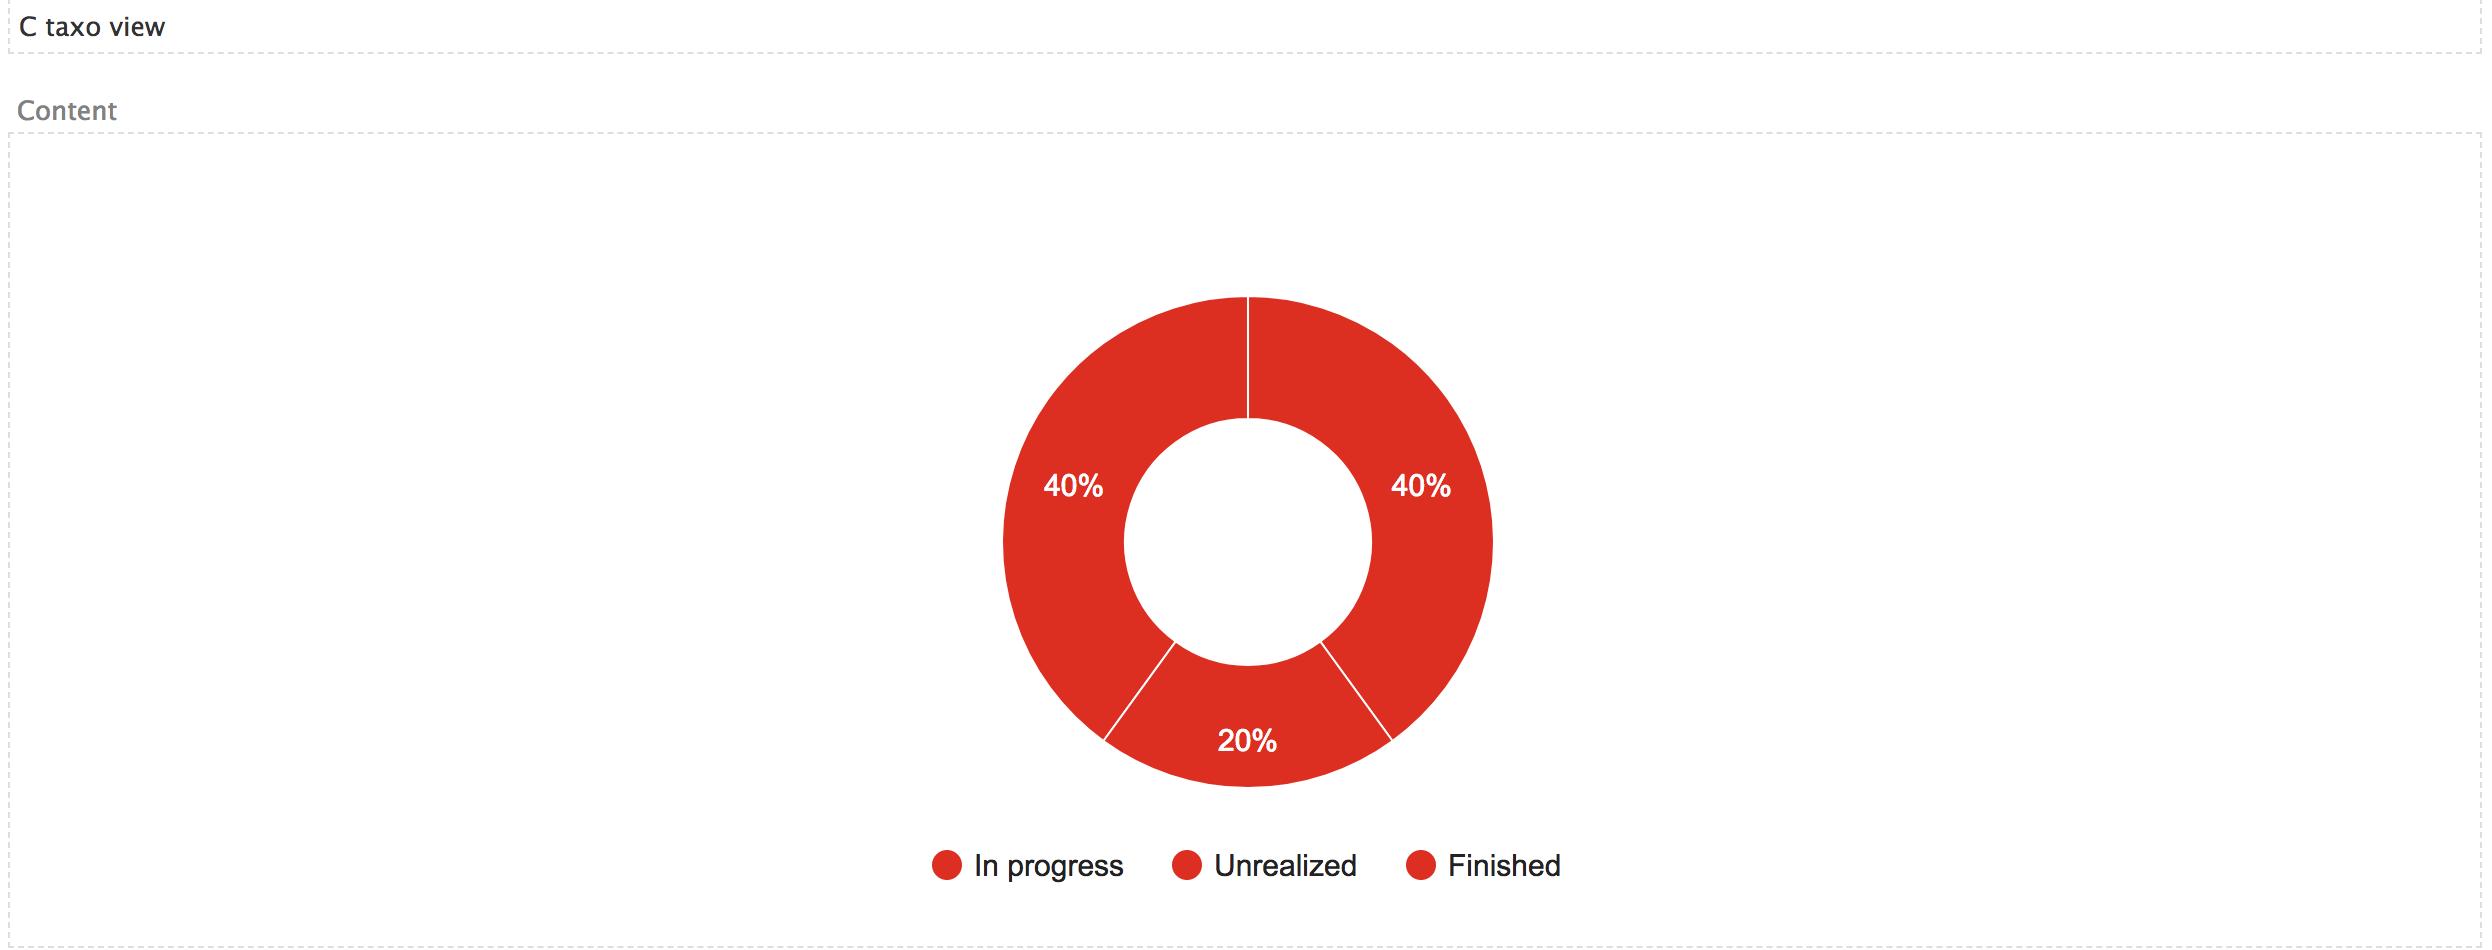
I have a taxonomy called - Status and inside there
When I use google chart there are three issues:
Attached:
Comment #8
andileco commentedPlease download the latest -dev and try using C3. You may need to edit your chart and reselect C3 as the library.
Comment #10
andileco commentedPlease try now with Google, too.
Comment #11
andileco commentedComment #13
andileco commentedComment #14
andileco commented