 Come together with the global Drupal community in Rotterdam, 28 Sept – 1 Oct 2026. Sessions, contribution, connection, and Early Bird savings until 8 June.
Performance Metrics
Last updated on
22 November 2022
Google Lighthouse is an open source tool that can perform a variety of website audits. In this test, all that changed between the before and after run is turning on the OEmbed Lazyload module. The site that the metric was ran on was a minimally configured Standard profile installation with the Bartik theme.
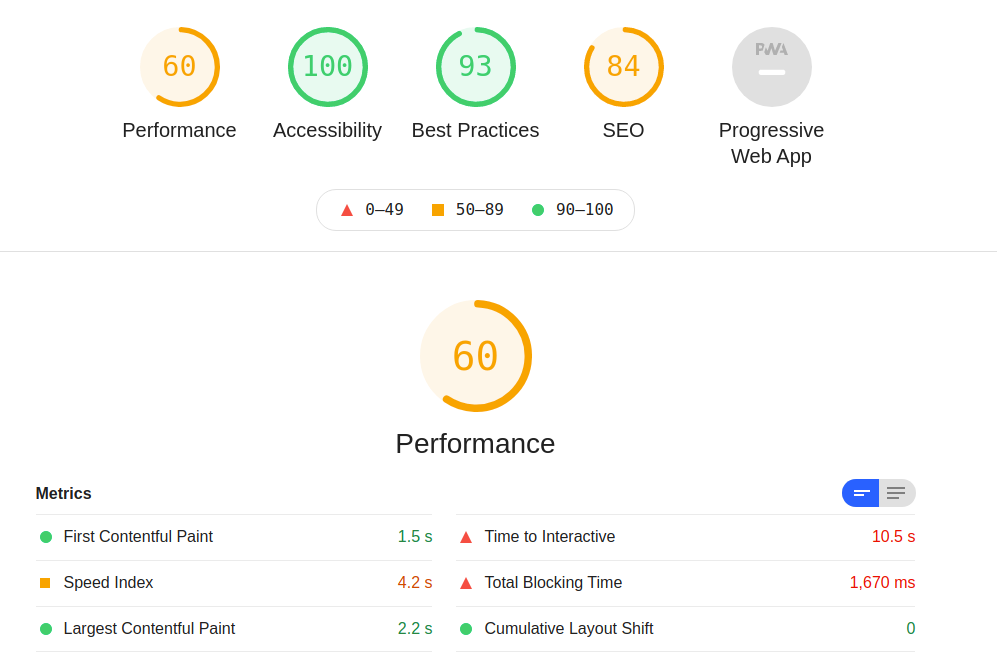
Lighthouse test with core oembed formatter
Notably, the Time to Interactive, 10.5 seconds and Total Blocking Time, 1670 milliseconds have some room for improvement.
Lighthouse test with oembed lazyload formatter
After enabling the module, Time to Interactive fell to 1.7 seconds and Total Blocking Time fell to 10ms.

Important Disclaimer
Performance benchmarks are notoriously difficult to get right. This is only a single test, which may fail to tell the whole story for every scenario. Do you have any metrics to share?
Help improve this page
Page status: No known problems
You can:
You can:
- Log in, click Edit, and edit this page
- Log in, click Discuss, update the Page status value, and suggest an improvement
- Log in and create a Documentation issue with your suggestion
