 Come together with the global Drupal community in Rotterdam, 28 Sept – 1 Oct 2026. Sessions, contribution, connection, and Early Bird savings until 8 June.
Generating a Google Map from custom fields in Views
One of the unique charts available in Views Chart Tools is the Google Map. Site builders can generate maps from custom fields use on various types of entities. In this tutorial we are going to generate a Google Map using custom node fields. We'll also look at how we can aggregate multiple address fields (street, city, country, etc) into a complete address for indicating specific points on the map.
Step 1: Set up
First we're going to generate a map that marks cities using a custom City field we've added to the Article node type. First let's look at the view setup.
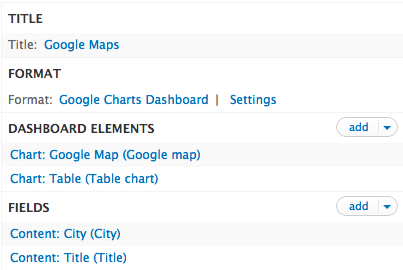
Here we've created a content view, enabled to Google Charts Dashboard style, and added our custom Address field and the content title to the view. We also added the Google Map chart and I chose to add an additional Table chart to the dashboard so we can view the results.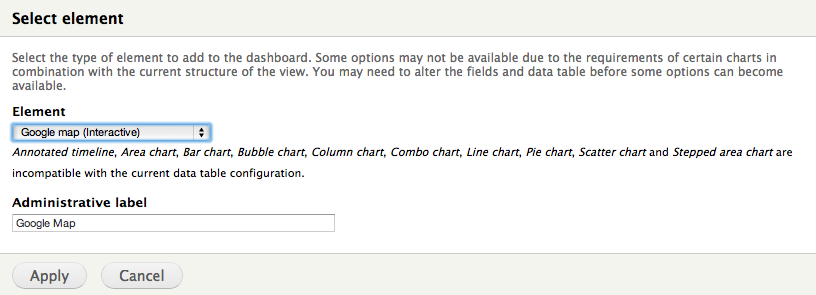
Step 2: Configuring the data table
Now that we have our view set up, it's time to configure the data table.
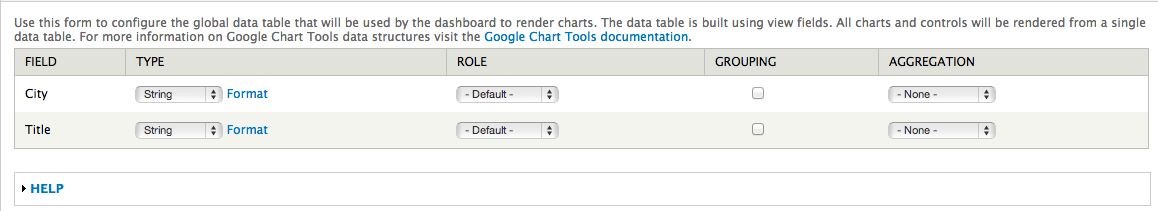
In this case, both of our columns are of type string, as is required by the Google Map chart type (note that we can also provide coordinates in the first two columns - latitude and longitude respectively). Since we're simply plotting the City field on our map, we don't need to group and aggregate our results (see the quarterly reports tutorial for examples of grouping, aggregating, and modifying view results). Once we've set our data types we can click Apply and view our results.
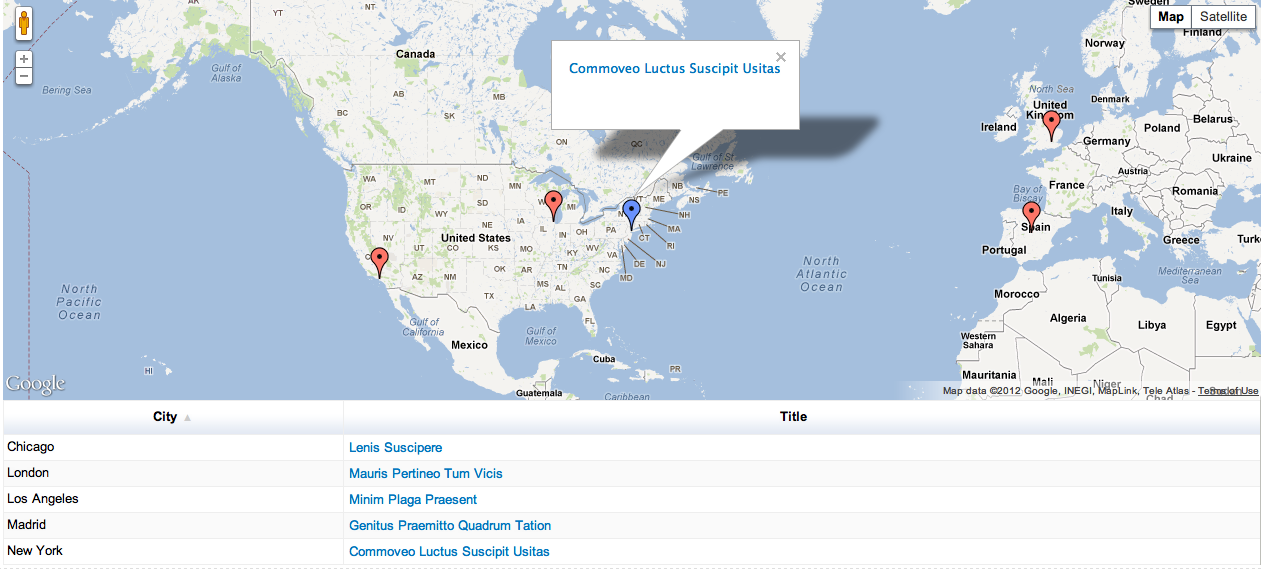
The map
Combining multiple address fields
While the major cities plotted in our previous example we successfully displayed, the fact is that most websites use more specific data. Let's take a look at how we can combine multiple address fields (city, state, etc) into a single address that can be understood by Google Charts. Here we've added and populated additional State and Country fields to the Article content type.
Step 3: Add additional fields to the view
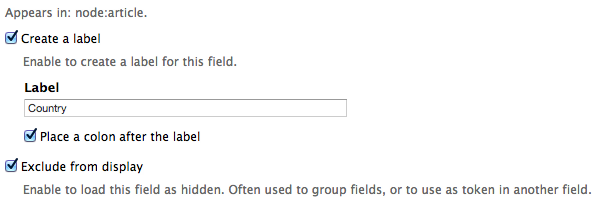
We need to add the new State and Country fields to our view. However, we want to use these fields as tokens rather than rendering their output. Therefore, we want to set the Exclude option in each field's settings. Make sure to exclude the already existing City field as well.
Step 4: Combine address fields with Custom text
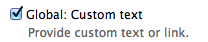
Finally, we need to make use of our address tokens. Here we'll add a final, Global: custom text field which will allow us to define a pattern for our address.
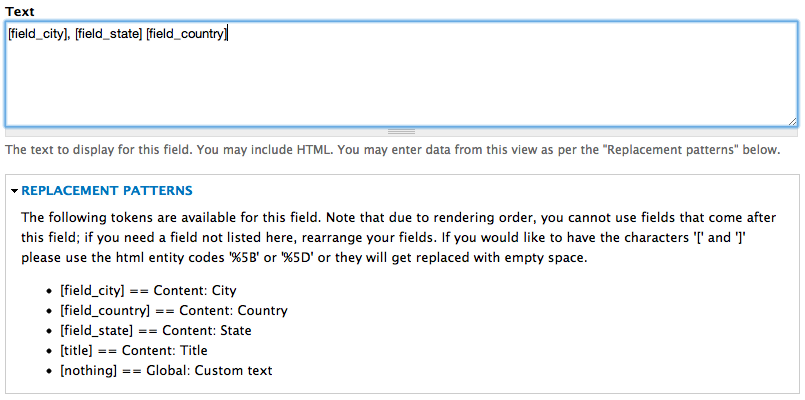
In order to get our address into a format that's acceptable by Google Maps, we're going to define a pattern in the custom text field that looks something like: [field_city], [field_state] [field_country].
Step 5: Cleaning up
We need to ensure that the data table is built in the order required by the Google Map chart. This means the address field needs to be the first column in the table. However, we also need to have access to the address tokens, so it needs to follow each individual address field. The final order should look something like this:

Additionally, it's wise to reconfigure the data table to ensure the settings are accurate, so go into the style settings and resubmit the form. You should still only see two fields on the data table form. That's because the data table ignores fields that are excluded from display.
The final result
Finally, we have our new map:

Help improve this page
You can:
- Log in, click Edit, and edit this page
- Log in, click Discuss, update the Page status value, and suggest an improvement
- Log in and create a Documentation issue with your suggestion
