 Support for Drupal 7 is ending on 5 January 2025—it’s time to migrate to Drupal 10! Learn about the many benefits of Drupal 10 and find migration tools in our resource center.
Experimental project
This is a sandbox project, which contains experimental code for developer use only.
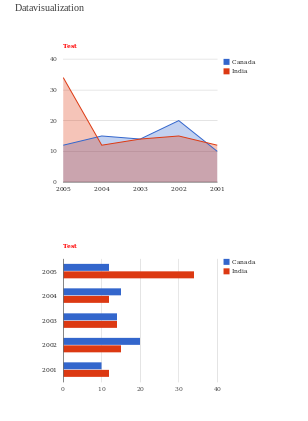
Google Chart Tools provide a perfect way to visualize data on your website. From simple line charts to complex hierarchical tree maps, the chart galley provides a large number of well-designed chart types. Populating your data is easy using the provided client- and server-side tools.
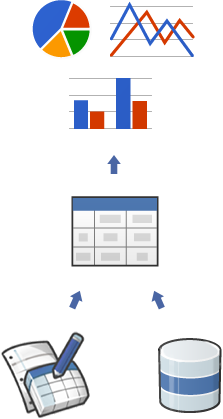
A chart depends on the following building blocks:
Chart Library
Charts are exposed as JavaScript classes. Google Chart Tools provides many chart types for you to use. Although the default appearance is best for most situations, you can easily customize a chart to fit the look and feel of your website. Charts are highly interactive and expose events that enable you to connect them to create complex dashboards or other experiences integrated with your webpage. Charts are rendered using HTML5/SVG technology to provide cross-browser compatibility (including VML for older IE versions) and cross platform portability to iPhones, iPads and Android. No plugins are needed.
DataTables
All charts are populated with data using a common JavaScript DataTable class. Having a common data structure makes it easy to switch between chart types. This class exposes methods for sorting, modifying, and filtering data. You can populate a DataTable programmatically from data that you retrieve from your own database, or you can request data from a data provider that supports the Chart Tools Datasource Protocol.
Datasources
You can query websites that implement
the Chart Tools Datasource protocol. The Datasource protocol includes a SQL-like query
language, and is implemented by Google Spreadsheets and Google Fusion Tables, as well as third party data providers such as SalesForce. You can even implement the protocol on your own website and become a data provider.
Project information
No further development
No longer developed by its maintainers.- Created by srutheesh on , updated


