
Hello,
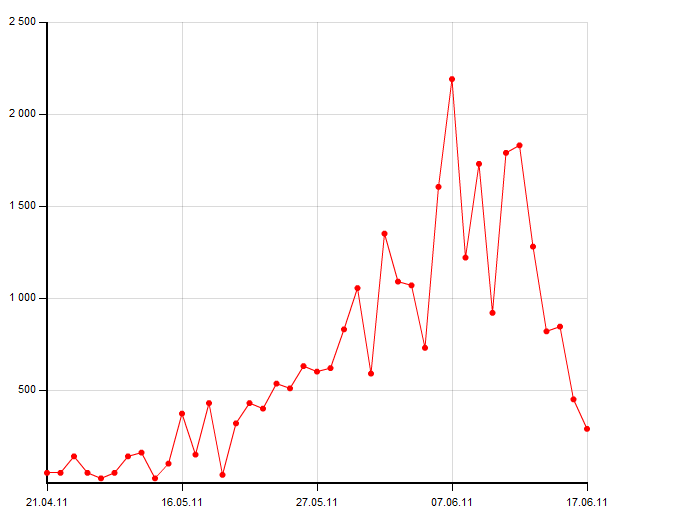
I 've created a nice Line Chart (using amCharts) showing the total ammount of "Sales per day".
Previously I 've used views_groupby module in order to group sales (on the same day) before showing them to the graph.
The issue I have is when one day I have no sales there is not such day to the view result, so the day is not displayed in the chart. I would like to see this day in the graph with a zero (0) ammount. Which is the best way to achieve this? Maybe by preproccessing the view result??
Thank you!
| Comment | File | Size | Author |
|---|---|---|---|
| #1 | linechart.png | 26 KB | xatiu |


Comments
Comment #1
xatiu CreditAttribution: xatiu commentedThis is the line chart I 've created.
As you can see the period 21.04.11 until 16.05.11 has 25 days but I have only 11 dots in the chart because I didn't have sales every day.