
Raven module provides integration with Sentry, an application monitoring and error tracking platform, allowing your Drupal site to send log events and performance traces to Sentry.
Sentry can capture all (or a user-defined subset of) Drupal log messages as well as errors that typically are not logged by Drupal: fatal PHP errors such as memory limit exceeded, fatal JavaScript errors, and exceptions thrown by Drush commands, and provides a full stacktrace and customizable metadata for each event.
You can use the Sentry hosted service or install Sentry (and/or Sentry Relay) on your own infrastructure (e.g. using Docker). An alternative lighter-weight open-source backend, GlitchTip, is also available.
This module can send the following types of events to Sentry:
- PHP fatal errors;
- Drupal log (watchdog) messages;
- Drush command exceptions;
- JavaScript exceptions, via @sentry/browser;
- Content Security Policy (CSP) reports, if CSP or Security Kit modules are installed; and
- Monitoring sensor status changes, if Monitoring module is installed.
You can choose which errors you want to catch by enabling desired error handlers and selecting error levels. A Sentry breadcrumb is recorded for each Drupal log message. If you use Monolog module, the README explains how to setup the drupal.raven Monolog handler to send log events to Sentry.

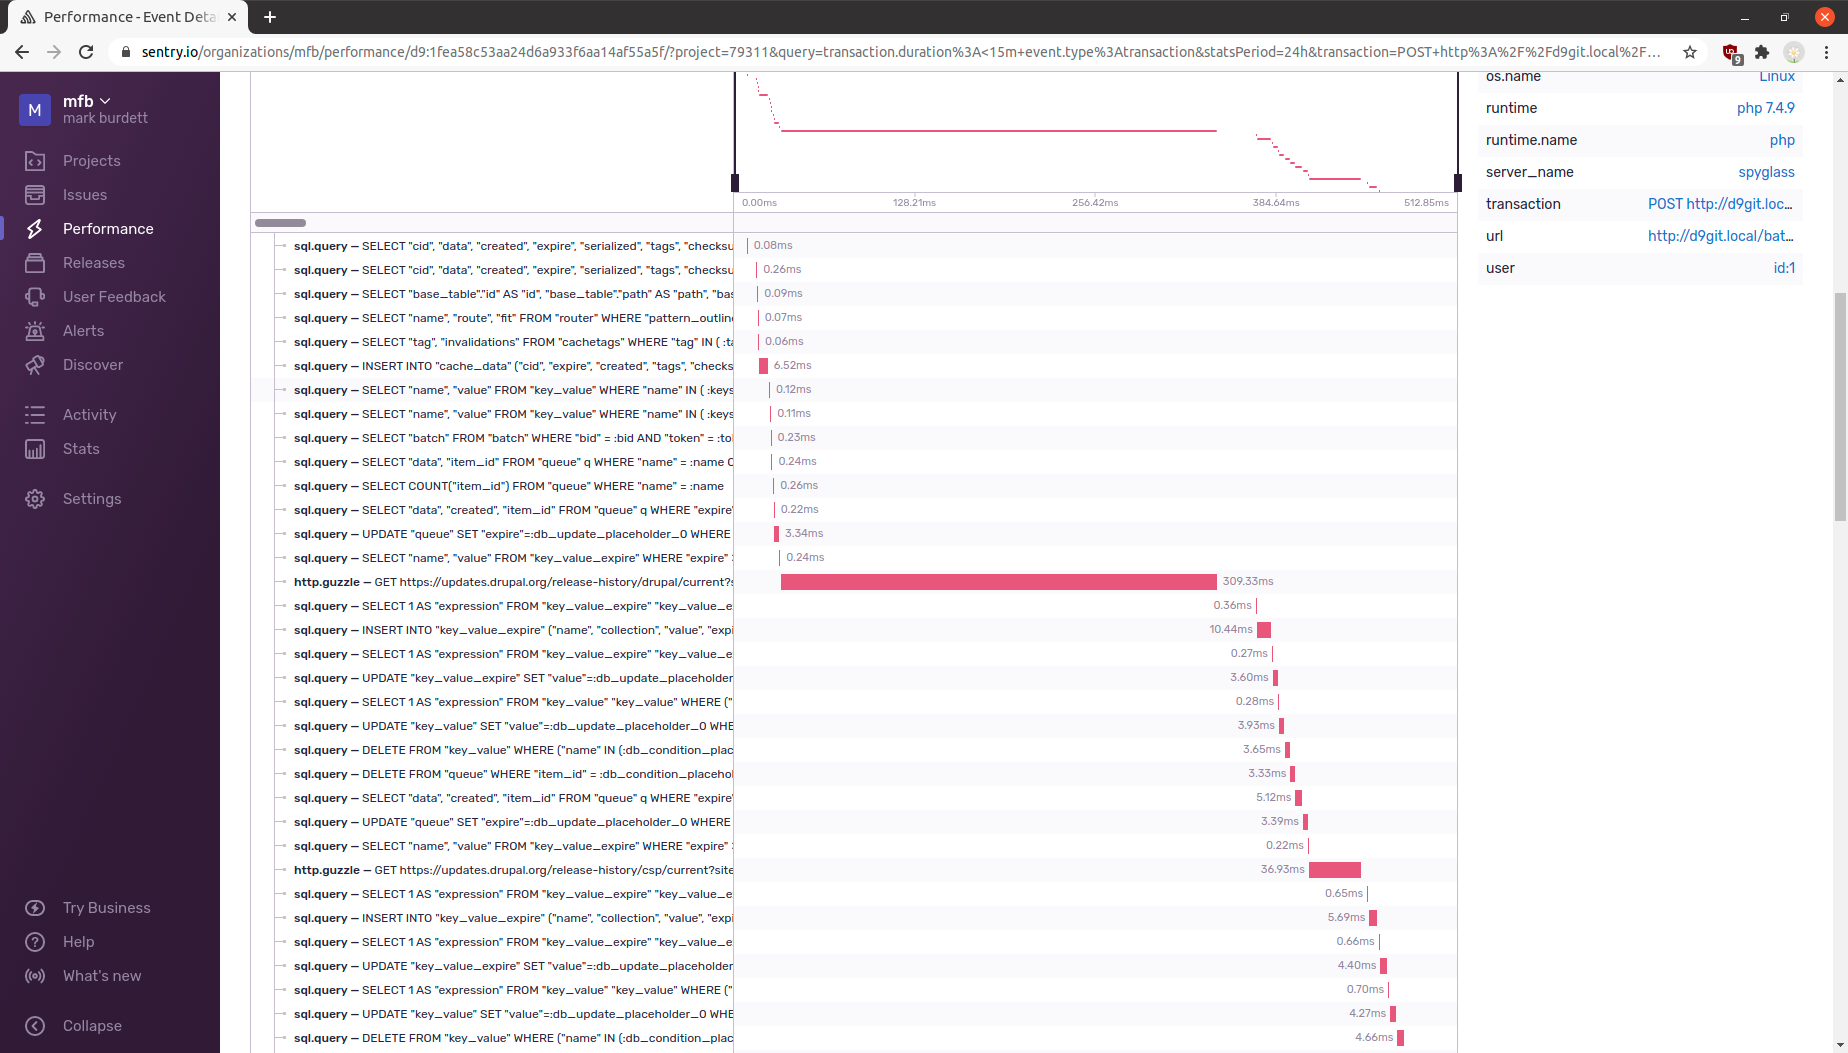
Raven module also integrates with Sentry performance tracing, both server-side and in the browser. If enabled on the module settings page, a transaction will be created for each request/response handled by Drupal, each page load in the browser, and each Drush command. Spans (timed operations) can be captured for:
- Requests made by Drupal's HTTP client;
- Database queries;
- Rendered Twig templates;
- Log messages sent to Sentry;
- Client-side spans captured by the Sentry browser SDK, including Interaction to Next Paint (INP) spans, if enabled; and
- Any spans created by custom code.
If you install the optional Excimer PHP extension and configure the profiling sample rate, Sentry can render highly detailed, interactive flame graphs.

You also have the option to enable Sentry release health monitoring, which sends a session event to Sentry for each page load, allowing you to track adoption and crash rate of new releases. If you enable the user feedback dialog option, users will be prompted to submit a crash report when JavaScript exceptions are thrown.

If you configure cron monitoring, Sentry will alert you when cron runs are missed and graph the average duration of cron runs over time.

| Raven release branch | Sentry PHP dependency | Sentry JavaScript |
|---|---|---|
| 5.x | 4.x | 7.x (ES6) |
| 4.x | 3.x | 7.x (ES6) |
| 3.x | 3.x | 6.x |
| 8.x-2.x | 1.x | 6.x |
| 7.x-4.x | 3.x | 6.x |
| 7.x-3.x | 1.x | 6.x |
| 7.x-2.x | 1.x | 3.x |
Credits:
This module is not affiliated with Sentry; it is developed and maintained by mfb. You can support development by contributing or sponsoring. Raven graphic by Hugh D’Andrade (Creative Commons Attribution License).
Supporting organizations:
Project information
- Module categories: Administration Tools, Developer Tools, Performance
- Ecosystem: Content-Security-Policy, Drush, Monitoring, Monolog, Security Kit
 4,735 sites report using this module
- Created by mfb on , updated
 Stable releases for this project are covered by the security advisory policy.
Look for the shield icon below.
Releases
5.0.11
released 15 April 2024
Works with Drupal: ^10.1
✓ Recommended by the project’s maintainer.
Install:
Development version: 5.x-dev updated 16 Apr 2024 at 00:28 UTC
4.0.28
released 27 March 2024
Works with Drupal: ^8 || ^9 || ^10
✓ Recommended by the project’s maintainer.
Install:
Development version: 4.x-dev updated 16 Apr 2024 at 00:27 UTC
3.2.27
released 27 November 2023
Works with Drupal: ^8 || ^9 || ^10
✓ Recommended by the project’s maintainer.
Install:
Development version: 3.x-dev updated 16 Apr 2024 at 00:32 UTC
7.x-4.19
released 16 November 2022
Works with Drupal: 7.x
✓ Recommended by the project’s maintainer.
Development version: 7.x-4.x-dev updated 15 Nov 2022 at 21:13 UTC
7.x-3.22
released 18 May 2022
Works with Drupal: 7.x
✓ Recommended by the project’s maintainer.
Development version: 7.x-3.x-dev updated 17 May 2022 at 23:57 UTC
7.x-2.20
released 27 January 2022
Works with Drupal: 7.x
Development version: 7.x-2.x-dev updated 22 Dec 2021 at 09:56 UTC


