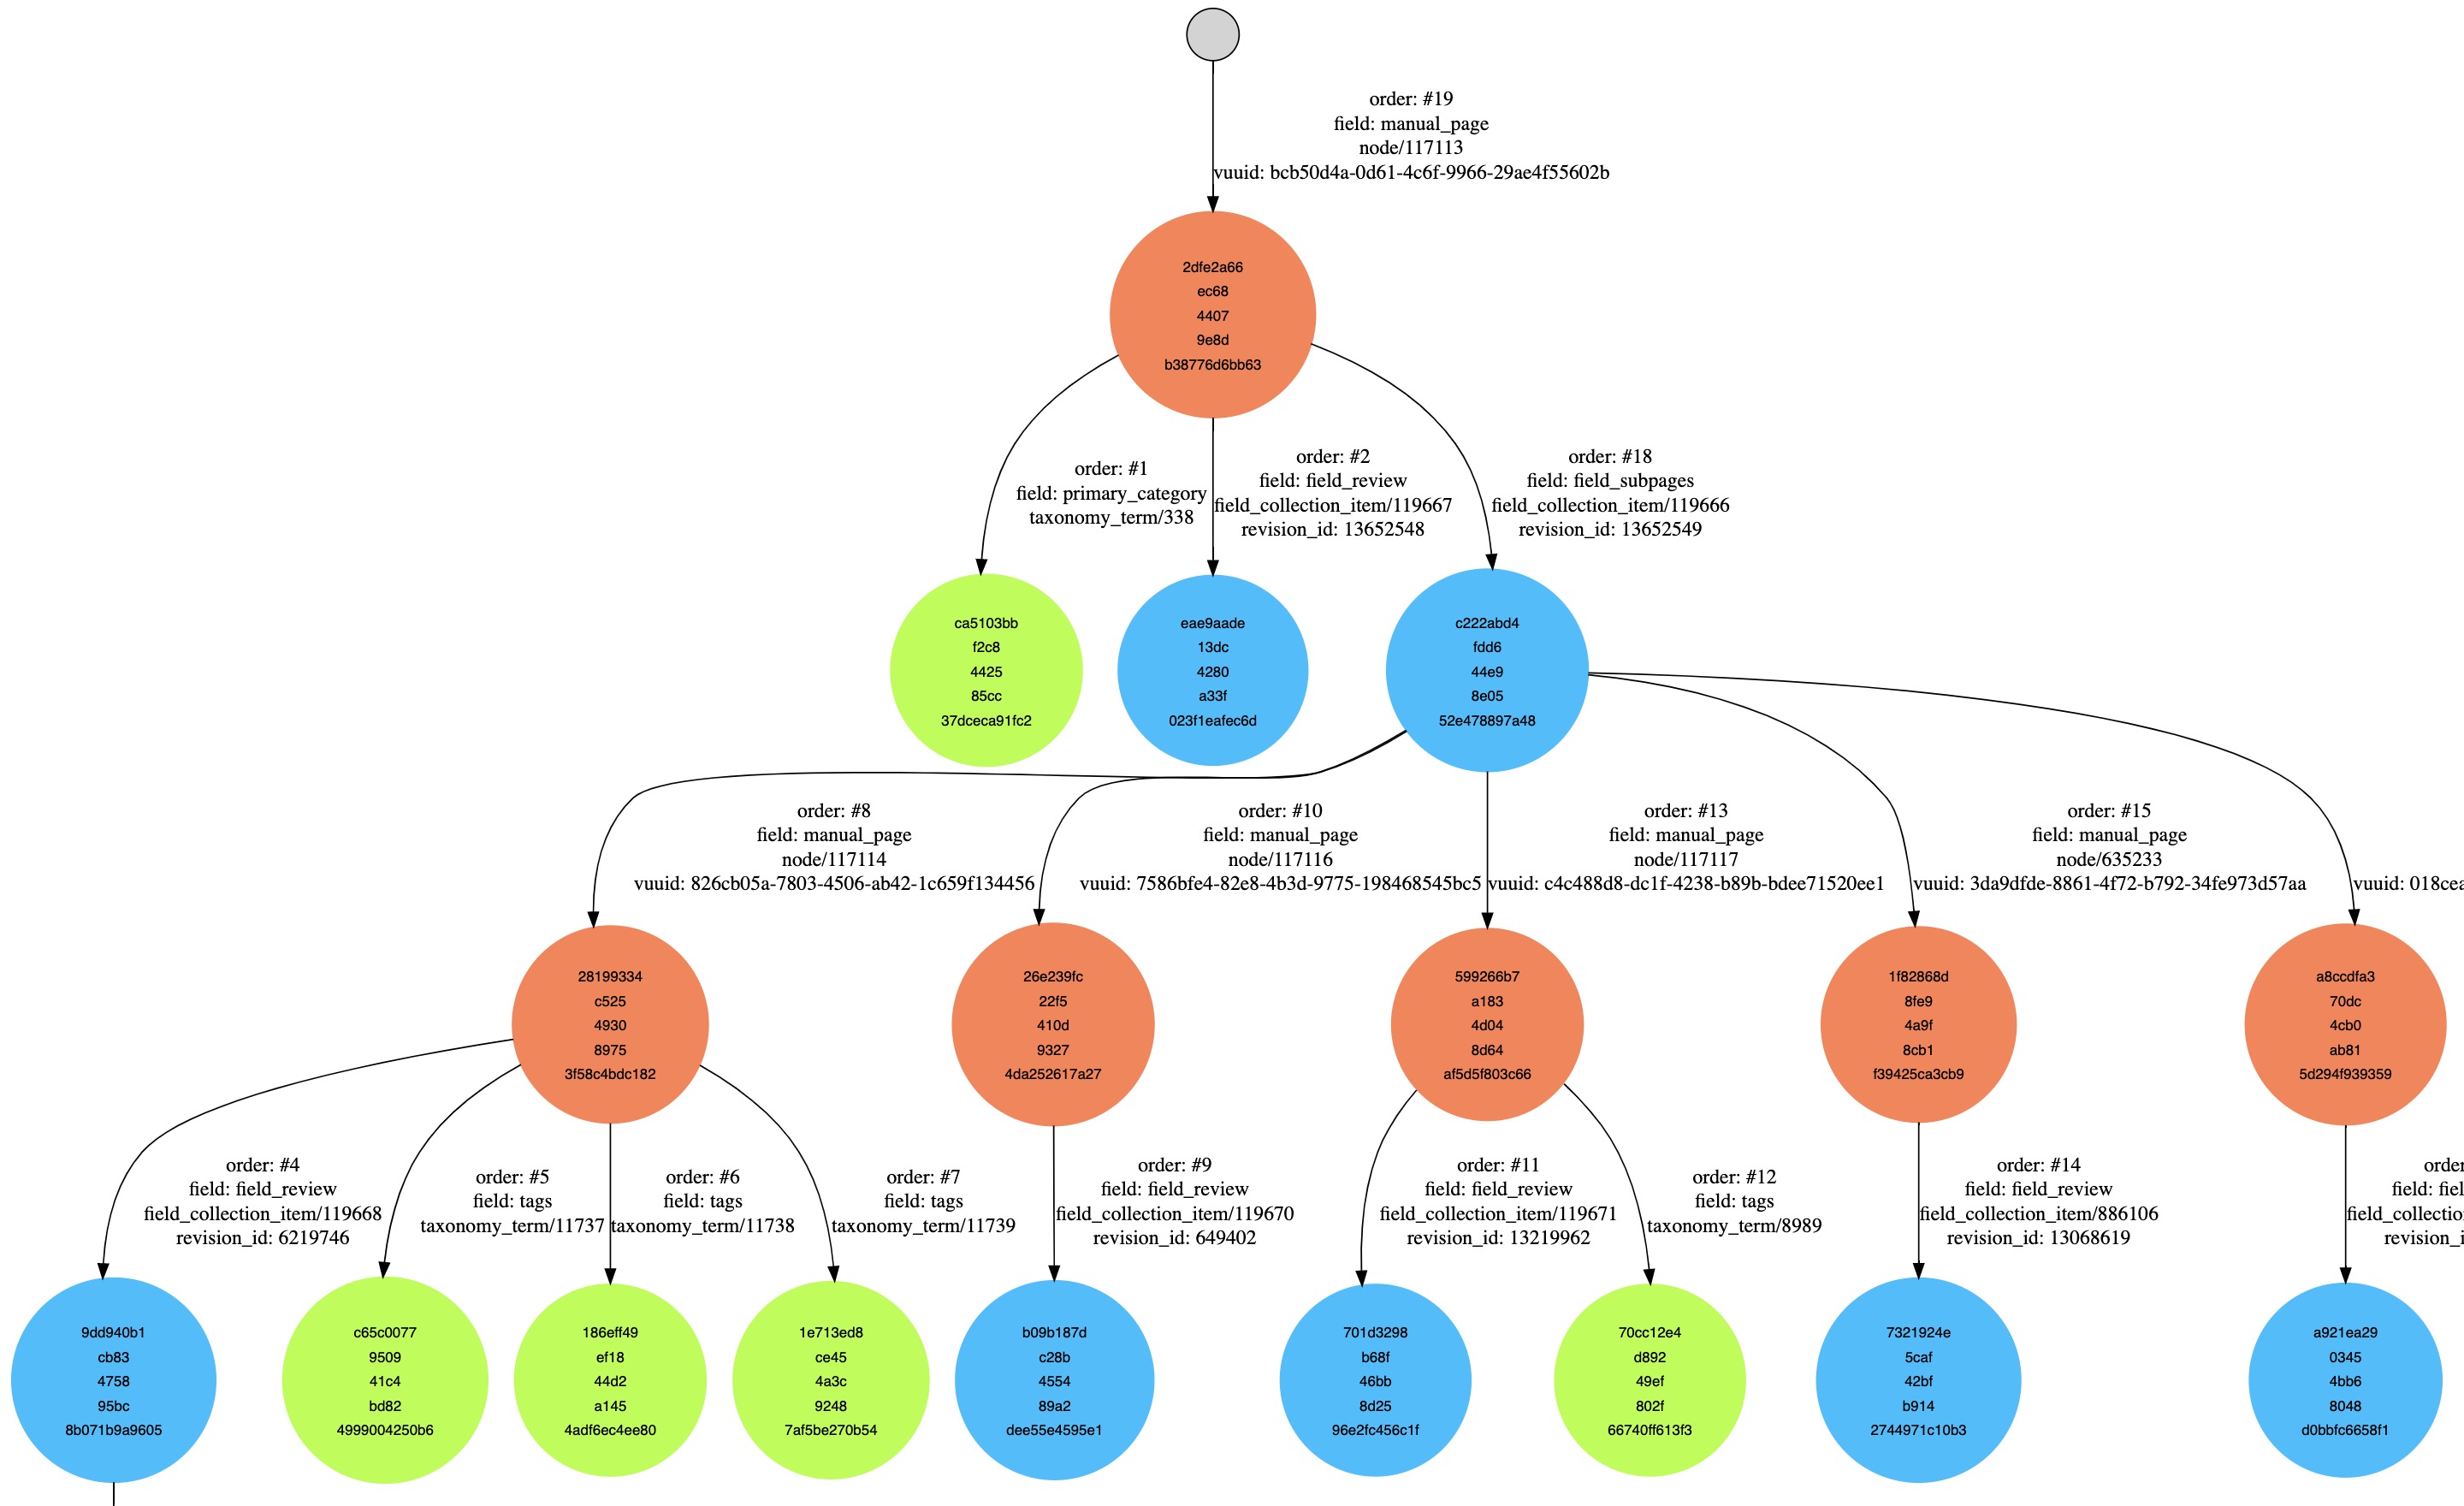
Understanding complex data relationships or managing content synchronization across different sites in Drupal can be very daunting. But with this innovative module, you can simplify this process effortlessly.
Designed to provide an intuitive graphical visualization of entity dependencies, this tool is invaluable for developers and site administrators who need to untangle complex relationships and detect potential circular dependencies seamlessly.
The tool is especially useful for analyzing intricate data structures and diagnosing potential circular dependencies.
Key Features
Graphical Visualization
Provides an intuitive visual representation of entity relationships, aided by Graphviz, allowing for easy zoom, pan, and string search within the graph.
Performance Management
To maintain site performance, the module limits the initial graph to a maximum nesting depth of 100 items.
This ensures a manageable overview and prevents timeouts or heavy server load. Users can continue to drill down into child items for deeper exploration.
Supported Entities
Compatible with a wide range of entities, including nodes, taxonomy terms, users, field collections, and paragraphs, across all Drupal versions.
Interactive and Exportable
Users can interact with the chart and view dependencies in detail, with the capability to export the graph's source code for offline analysis or further refinement on the Graphviz website.
Use Cases
Identify Circular Dependencies
Quickly detect circular dependencies to prevent endless loops, enhancing site performance and reliability.
Simplify Complex Data Structures
Designed to help unravel and clarify intricate relationships across various entity types, making maintenance and updates more straightforward.
How to Get Started
- Navigate to an entity's page and find the "Dependency Visualization" option in the local tasks menu.
- Open the visualization chart for an overview of the entity's dependencies, with the ability to zoom, pan, and search within the graph.
- Click on any item in the chart to drill down into its specific dependencies, gaining a more detailed understanding of its related data.
- Access the module's configuration page to customize the appearance of the graphs according to your preferences.
Drupal 7
Once you enable the module, you will see a tab 'Entity graph' when you view entities.
Requires: Entity Dependency API
Drupal 8 and above
Once you enable the module, you will see a tab 'Content dependencies' on the local tasks when you view entities.
Supports Dependency Calculation
You need to enable Dependency Calculation manually to use it.
Troubleshooting
If you have errors when upgrading to the latest code, you need to uninstall the module first and reinstall after downloading the latest code.
Powered by: http://www.webgraphviz.com
Works with Acquia Content Hub
Project information
- Project categories: Content editing experience, Decoupled, Developer tools
- Ecosystem: Deploy - Content Staging, Acquia Content Hub, Entity Dependency API, Dependency Calculation
1 site reports using this module
- Created by marcelovani on , updated
Stable releases for this project are covered by the security advisory policy.
There are currently no supported stable releases.

Releases
Initial release
Development version: 8.x-1.x-dev updated 9 Jan 2025 at 16:03 UTC