
Good morning,
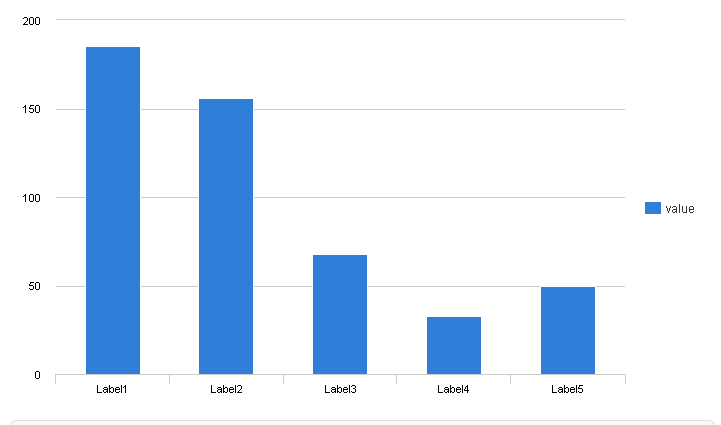
I am consuming JSON data (json_views_plugin) to plot chart values from a JSON feed and would like the columns to be different colors.
Somehow, in the recesses of my brain, I am SURE I had this working at one time... Can anyone suggest anything? "Use Aggregation" is not available in the view settings so I can't group the that way.
{"success":true,
  "data":
   [
    {"Label":"Label1","value":"5","Chart Record":1},
    {"Label":"Label2","value":"10","Chart Record":2},
    {"Label":"Label3","value":"15","Chart Record":3},
    {"Label":"Label4","value":"20","Chart Record":4},
    {"Label":"Label5","value":"25","Chart Record":5}
   ],
  "time":
  [
    {"Update Time":"2015-03-31 09:58:00"}
  ],
 "notFound":false,
 "totalCount":5
}| Comment | File | Size | Author |
|---|---|---|---|
| chart1.png | 7.34 KB | fgjohnson@lojoh.ca |


Comments
Comment #1
fgjohnson@lojoh.ca CreditAttribution: fgjohnson@lojoh.ca commentedEven a different JSON format would work for us.