
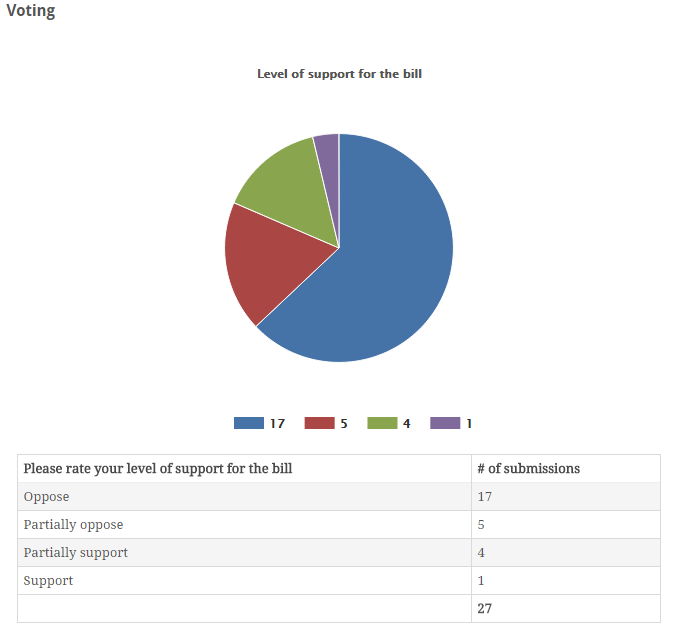
I have a simple table from a webform survey as per the attachment.
I cannot configure the table to show the labels correctly. They show as the number of votes, not as the labels in column 1.
Can anyone assist?
| Comment | File | Size | Author |
|---|---|---|---|
| #10 | screenshot-epic 2015-09-04 14-46-31.jpg | 58.17 KB | apmsooner |
| #7 | views.jpg | 75.82 KB | apmsooner |
| #4 | Pie chart legend wrong.png | 95.84 KB | RdeBoer |
| #1 | ISP data retention comments TelSoc.png | 35.56 KB | GrahamShepherd |


Comments
Comment #1
GrahamShepherd CreditAttribution: GrahamShepherd commentedComment #2
GrahamShepherd CreditAttribution: GrahamShepherd commentedComment #3
GrahamShepherd CreditAttribution: GrahamShepherd commentedComment #4
RdeBoerHi Graham,
Thank you for your report.
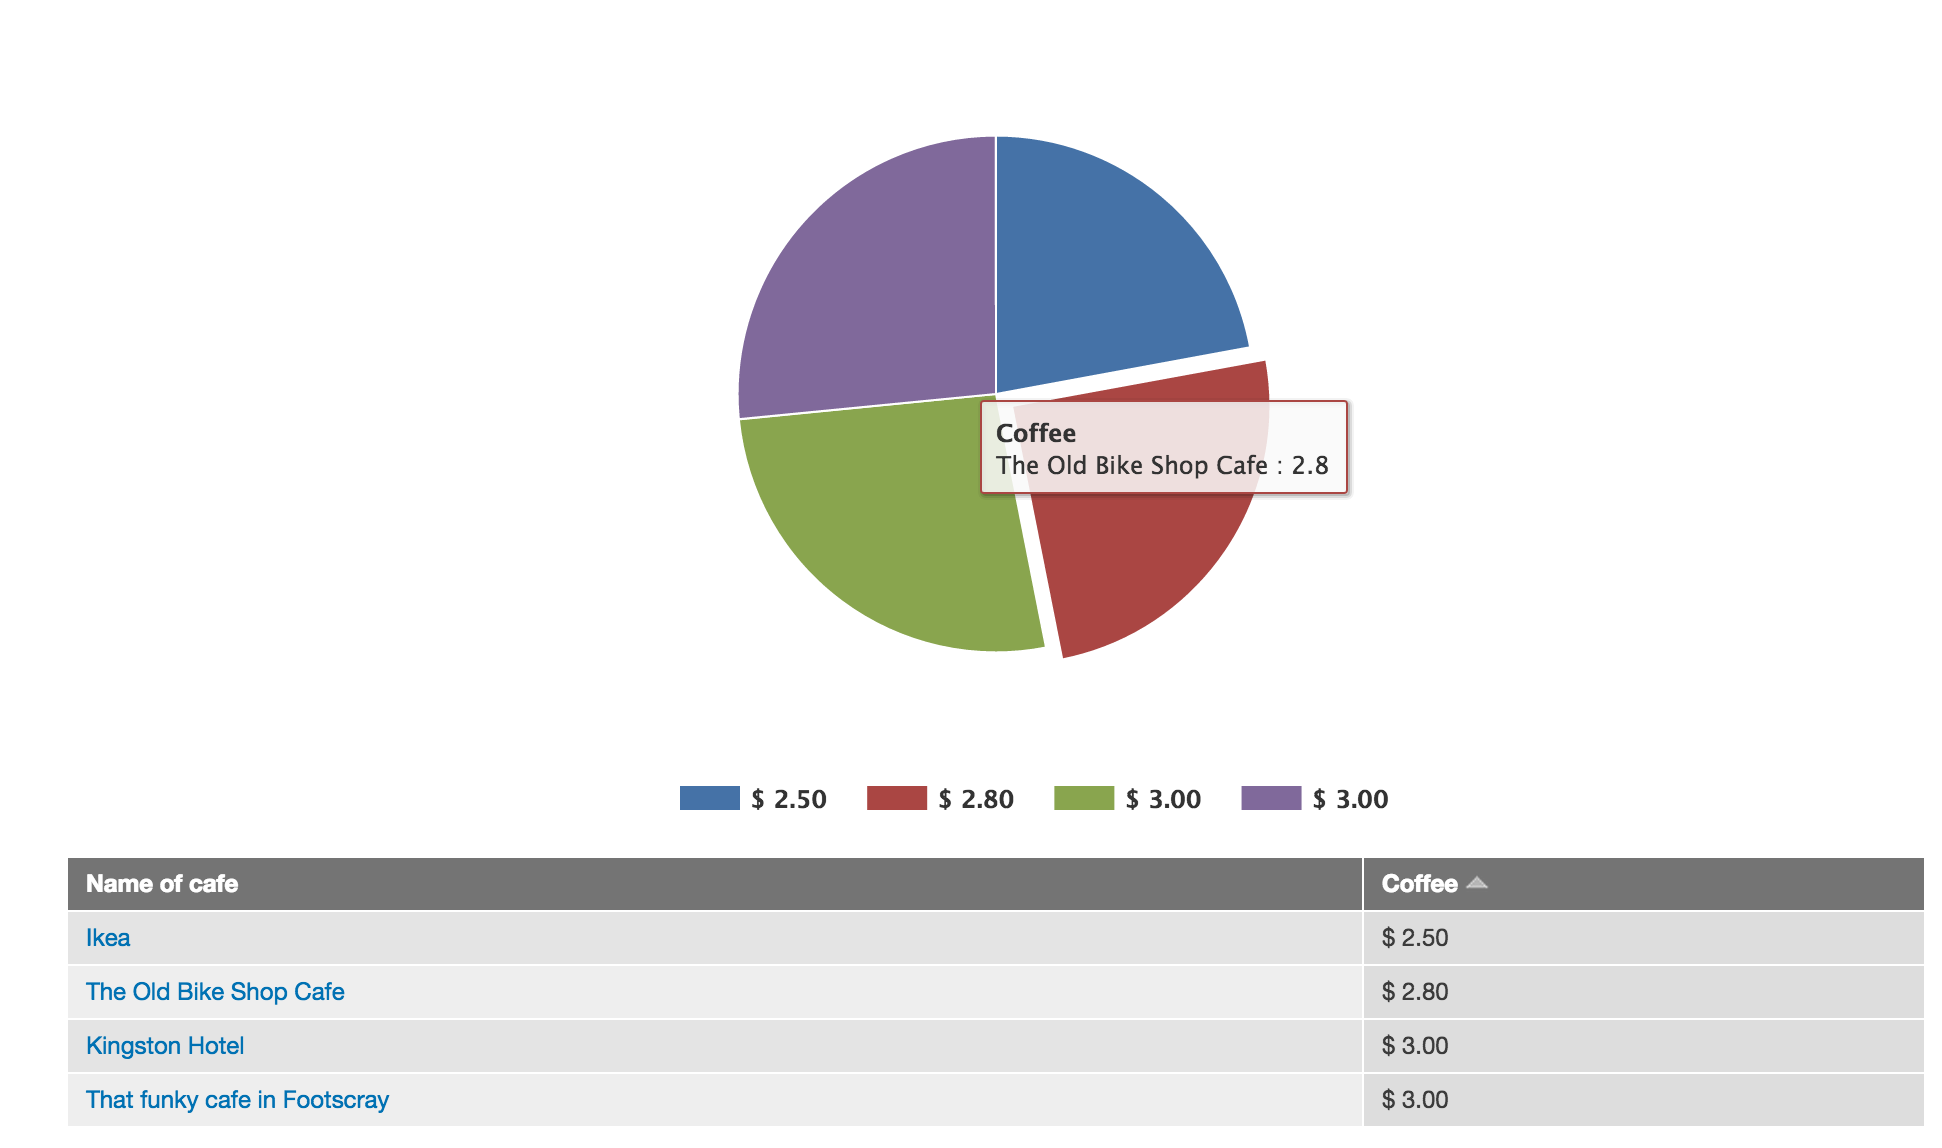
I was able to confirm your issue with my own dataset (see screenshot; not a Webform, but that is irrelevant anyway).
Basically the pie chart is correct, but the legend shows the "Y" values rather than the names ("X" values).
When one hovers over a piece of the pie, the correct pairing X: Y displays.
This is likely an issue outside this module.
I checked this issue queue: https://github.com/highchartTable/jquery-highchartTable-plugin/issues, but could not find anything.
I'll run the debugger over it some time soon to confirm.
Rik
Comment #5
RdeBoerComment #6
RdeBoerComment #7
apmsooner CreditAttribution: apmsooner commentedWhat it sounds like here is the ability to choose a column number to extract the value from to serve as the legend label. The example from highcharts table is showing this ability by passing a data attribute:
For tables generated by views, it would be nice feature to be able to set data attributes at the field level much like classes are set. Rick, is there any way of setting this perhaps from a column number in the chart configuration aside from a feature request on the views module?
Comment #8
RdeBoer@apmsooner,
I feel we can safely rule out a Feature Request on the Views module for this.
Will have to look at our code to see what we can do in our module.
Rik
Comment #9
apmsooner CreditAttribution: apmsooner commented@rick,
Idea:
Could an integer input field be added to the chart settings to determine a column number to pull for series name per the functionality added here: https://www.drupal.org/node/2423367
Per this example http://jsfiddle.net/gh/get/jquery/1.9.1/highslide-software/highcharts.co..., the :name is determining the legend i think it could be passed in through highChartConfig?
Comment #10
apmsooner CreditAttribution: apmsooner commentedHere's an additional little hacky solution that works for views....
1. copy views-view-table.tpl.php file into theme folder
2. add data attribute to
<td>tag using the field class variable:3. Under style options, uncheck default classes and add token from field you want to use as the legend label for the field class. See attached screenshot.
I think there could be a case for adding a contrib module that would add a fieldset for each field setting form called "Attributes" with modified views templates that output the variables. I'm not sure how to tap into the views api to implement such a task but this little workaround might help someone for now...
Comment #11
RdeBoer@apmsooner: Thanks for your investigations and solutions.
Want to have a go at implementing #9 yourself? You have commit rights!
Rik
Comment #12
bisonbleu CreditAttribution: bisonbleu commentedSolution in #10 works but step 1 and 2 need to be updated as follows.
views-aggregator-results-table.tpl.phpfile into your theme folder<td>tag using the field class variable i.e. replace<td>...</td>with the code below.Comment #13
rajngrg09 CreditAttribution: rajngrg09 commented#10 worked. Thanks