
Hello
I'm working with the charts module and i define the 'options' array like this:
$info=array();
//$info=charts_element_info();
//echo "at the top<p>";
$info['chart']=array();
$info['chart']['#type']='chart';
$info['chart']['#chart_type']='scatter';
$info['chart']['#chart_library']='highcharts';
$info['chart']['#raw_options']=array('turboThreshold'=>$cantidad_datos);
$info['chart']['#chart_id']='test_highcharts';
$info['chart']['#title']=$titulo;
$info['chart']['#width'] = '600px';
$info['chart']['#height'] = '400px';
$info['chart']['#tooltops']=TRUE;
 $axis_properties_x = array(
    '#type' => 'chart_xaxis',
   '#axis_type' => 'datetime', // Options: linear, logarithmic, datetime, labels.
    '#title' => 'Fechas',
    '#title_color' => '#000',
    '#title_font_weight' => 'normal', // Options: normal, bold
    '#title_font_style' => 'normal', // Options: normal, italic
    '#title_font_size' => 12, // CSS value for font size, e.g. 1em or 12px.
    '#labels' => NULL,
    '#labels_color' => '#000',
    '#labels_font_weight' => 'normal', // Options: normal, bold
    '#labels_font_style' => 'normal', // Options: normal, italic
    '#labels_font_size' => NULL, // CSS value for font size, e.g. 1em or 12px.
    '#labels_rotation' => -45, // Integer rotation value, e.g. 30, -60 or 90.
    '#grid_line_color' => '#ccc',
    '#base_line_color' => '#ccc',
    '#minor_grid_line_color' => '#e0e0e0',
    '#max' => NULL, // Integer max value on this axis.
    '#min' => NULL, // Integer minimum value on this axis.
    '#opposite' => FALSE, // Display axis on opposite normal side.
   '#dateFormat' => '%d/%m/%Y',
  );
 $axis_properties_y = array(
    '#type' => 'chart_yaxis',
   '#axis_type' => 'linear', // Options: linear, logarithmic, datetime, labels.
    '#title' => $variable,
    '#title_color' => '#000',
    '#title_font_weight' => 'normal', // Options: normal, bold
    '#title_font_style' => 'normal', // Options: normal, italic
    '#title_font_size' => 12, // CSS value for font size, e.g. 1em or 12px.
    '#labels' => NULL,
    '#labels_color' => '#000',
    '#labels_font_weight' => 'normal', // Options: normal, bold
    '#labels_font_style' => 'normal', // Options: normal, italic
    '#labels_font_size' => NULL, // CSS value for font size, e.g. 1em or 12px.
    '#labels_rotation' => -45, // Integer rotation value, e.g. 30, -60 or 90.
    '#grid_line_color' => '#ccc',
    '#base_line_color' => '#ccc',
    '#minor_grid_line_color' => '#e0e0e0',
    '#max' => NULL, // Integer max value on this axis.
    '#min' => NULL, // Integer minimum value on this axis.
    '#opposite' => FALSE, // Display axis on opposite normal side.
  );

  $info['chart']['xaxis'] =array() +$axis_properties_x;
  $info['chart']['yaxis'] =array() +$axis_properties_y;

$info['chart']['chart_data']['#title']=$variable;
$info['chart']['chart_data']['#type'] = 'chart_data';
$info['chart']['chart_data']['#data']=$value;
//$info['chart']['chart_data']['#data']=array(array("1/01/2015", 10),array("4/01/2015", 20),array("6/01/2015", 30));
$info['chart']['chart_data']['#decimal_count']=3;
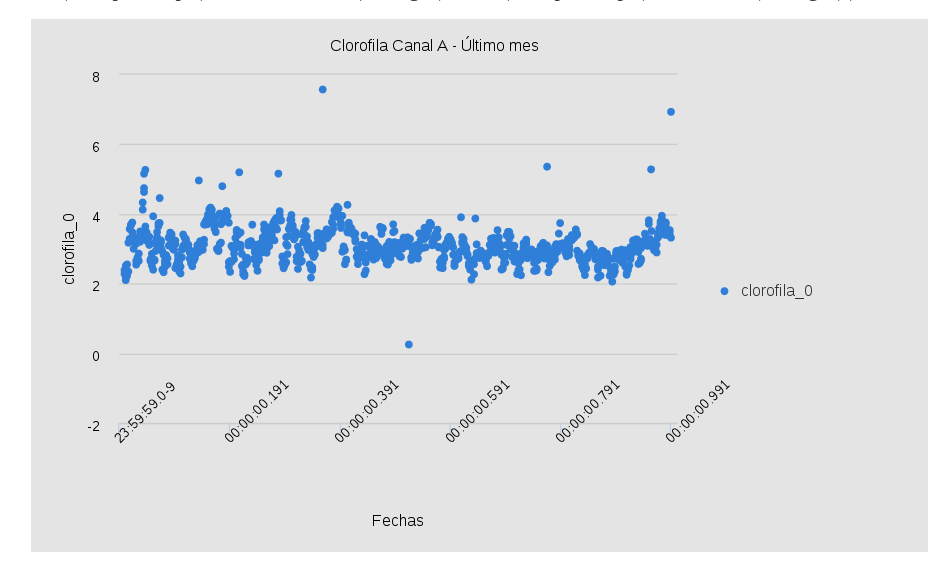
I have a serial data with data-value and i expects to show 'date' and 'date' value but it show the chart like the image
To render i use the following code, i'm not using the prerender funcionts yet;
$chart=$info;

//echo "<pre>";print_r($chart);echo "</pre>";

        $row[] = array(
          'data' => drupal_render($chart['chart']),
          'valign' => 'top',
        );
$table['rows'][] = $row;
return theme('table', $table);
Now i need to show the correct date format and the value not the index, how i can do it?
| Comment | File | Size | Author |
|---|---|---|---|
| chart_highcharts.png | 44.57 KB | pineiden |


Comments
Comment #1
Pierre.Vriens CreditAttribution: Pierre.Vriens commentedI'm trying to understand what the actual question here is, is it possible to add a new comment with only the actual question please?
I THINK the question is related to #dateFormat ... if that's the case, then here are some links that might help find the answer (or at least help me to some day continue the research on this issue ...):
Anybody out there who can provide some explanation (maybe even documentation) about this?
PS: Expecting "Support requests" to be handled (for free ...) with priority Major seems like a contradictio-in-terminus to me. That is what "Premium support" is all about (Contact me for details ...).
Comment #2
andileco CreditAttribution: andileco at JSI Research & Training Institute, Inc. (JSI) commented