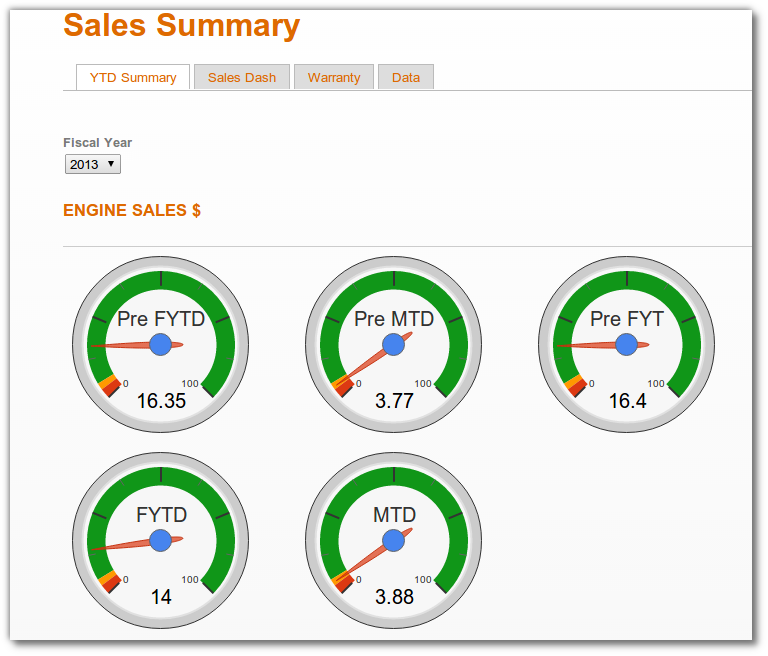
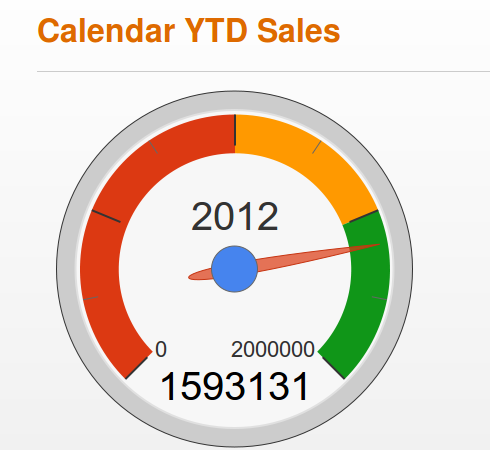
I was able to create a Gauge chart easily with this module with the exception of the Date field issue. But the values for the gauge exceed the ticks on the gauge, therefore the needle pegs every time.
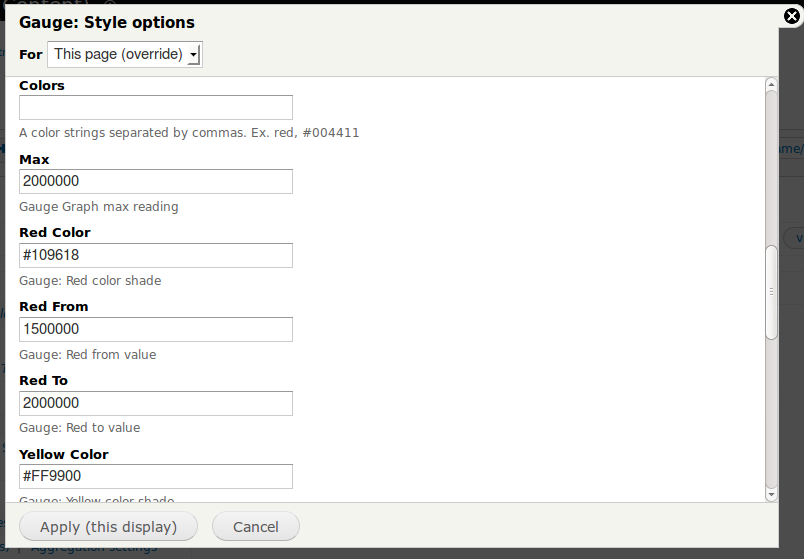
Also, how can the colors and values for the different color zones of the gauge be change?

Support from Acquia helps fund testing for Drupal Acquia logo

Comments

joaomachado’s picture

So, I did a little research and found that I could modify the google_chart_tools_views_plugin_style.inc file and add the missing options for the gauge from here https://developers.google.com/chart/interactive/docs/gallery/gauge , I think this needs to be added to the module and maybe others can test it.

Unfortunetaly I don't know how to submit patches or use GIT...

settings

Gauge

Joao

konforti’s picture

Category: support » feature
Status: Active » Needs work

Thank you @joaomachado, this might be cool addition to the module.
But please attach a valid patch so other can review your changes.

joaomachado’s picture

But please attach a valid patch so other can review your changes.

Way over my head, I was lucky to figure that out :-)

joaomachado’s picture

OK, I tried to make a patch...someone please test..

Note: if not using the gauge graph leaving all of the fields relating to the gauge blank should not effect the other graphs, I think!

Can of worms being opened...

joaomachado’s picture

Is there any chance of getting this patch added as a feature? IS there anything that I can help with to do so?

John

joaomachado’s picture

Title: Google Chart Gauge pegs needle » Google Chart Gauge Feature Request

Changed the title to better reflect the request.

bazzly’s picture

Patch seems to work for me, but I noticed I lost my drop-down to choose chart type, and the ability to name the Vertical and Horizontal.

Using 7.x-1.3+13-dev

Thanks!! I post back should anything go wrong.

konforti’s picture

Status: Needs work » Needs review
joaomachado’s picture

I am a little buried for the next week or so but I will try to work on the patch using the current dev version.

As a side note, I am usig this module to create a Sales Dashboard for the company I work for and they are slobbering all over this gauge feature, apparently Dashboards are the big sales analytics thing now. Especially with creating attached vews with combination gauges, graphs etc..

Joao

konforti’s picture

Hi @joaomachado, I want to suggest creating a new, different views-style plugin for the Gauge charts.
It's seems (to me) that it become a bit too messy to keep it all together.

A patch is attached, based on your patch, for new views-style plugin.
Please review.

Can you please provide here the exports of the view which you dealing or testing with?

Thanks.

bazzly’s picture

There anyway to have the patch work with the 7.x-1.4 version so I could test it out as well?

Thanks

joaomachado’s picture

I am buried up to my eye balls this week, but here is the data I think you are looking for.
The views export of the gauges I have done so far.

Views Export.txt

Also some screenshots of the gauges.

Multiple Views attached

Another View with Gauges without colors

View with Gauge colors

joaomachado’s picture

@konforti

This sounds like a much better way to go...I will test as soon as I can. I am not much of a coder so please beware.

Joao

bazzly’s picture

I got it working on the .4 version. Cool and good job guys!!

bazzly’s picture

Just an FYI, Patch seems to work, but I still lost my drop-down to choose chart type (no big deal), and the ability to name the Vertical and Horizontal are gone.

Thanks

joaomachado’s picture

Patch from comment 10 fails for me on both 7.14 and 7.1.x-dev

"line 267 malformed"

IKE0088’s picture

+1 subscribe

IKE0088’s picture

when I first started testing the patch from #4, I lost all of my grouping capabilities. I modified the following file:
sites/all/modules/google_chart_tools/google_chart_tools_views/views/google_chart_tools_views_plugin_style.inc
using the following code:

<?php
/**
 * @file
 * Contains the Google Chart Tools display plugin.
 */

/**
 * The views style plugin.
 *
 * @ingroup views_style_plugins
 */
class google_chart_tools_views_plugin_style extends views_plugin_style {
  
  function option_definition () {
    $options = parent::option_definition();
    
    $options['title'] = array('default' => '');
    $options['type'] = array('default' => 'LineChart');
    $options['width'] = array('default' => 600);
    $options['height'] = array('default' => 400);
    $options['curve'] = array('default' => 0);
    $options['3d'] = array('default' => 0);
    $options['colors'] = array('default' => '');
    $options['max'] = array('default' => 100);
    $options['redColor'] = array('default' => '#DC3912');
    $options['redFrom'] = array('default' => '');
    $options['redTo'] = array('default' => '');
    $options['yellowColor'] = array('default' => '#FF9900');
    $options['yellowFrom'] = array('default' => '');
    $options['yellowTo'] = array('default' => '');
    $options['greenColor'] = array('default' => '#109618');
    $options['greenFrom'] = array('default' => '');
    $options['greenTo'] = array('default' => '');
    $options['animation.duration'] = array('default' => 400);
    $options['animation.easing'] = array('default' => '');
    
    return $options;
  }

  function options_form(&$form, &$form_state) {
    parent::options_form($form, $form_state);

    // Only allow grouping on the first column.
    $form['grouping'] = array_slice($form['grouping'], 0, 1);
    $form['grouping'][0]['field']['#options'] = array_slice($form['grouping'][0]['field']['#options'], 0, 2);

    $form['title'] = array(
      '#type' => 'textfield',
      '#title' => t('Title'),
      '#description' => t('Chart title.'),
      '#default_value' => $this->options['title'],
    );
    $form['type'] = array(
      '#type' => 'textfield',
      '#title' => t('Type'),
      '#description' => t('Chart type, see <a href="https://google-developers.appspot.com/chart/interactive/docs/gallery">Google Chart Tools gallery</a>.'),
      '#size' => 16,
      '#required' => TRUE,
      '#description' => t('Ex. LineChart, PieChart, ColumnChart, AreaChart, Gauge, BarChart, etc....'),  
      '#default_value' => $this->options['type'],
    );
    $form['width'] = array(
      '#type' => 'textfield',
      '#title' => t('Width'),
      '#description' => t('Chart width in pixels'),
      '#size' => 8,
      '#required' => TRUE,
      '#default_value' => $this->options['width'],
    );
    $form['height'] = array(
      '#type' => 'textfield',
      '#title' => t('Height'),
      '#description' => t('Chart height in pixels'),
      '#size' => 8,
      '#required' => TRUE,
      '#default_value' => $this->options['height'],
    );   
    $form['curve'] = array(
      '#type' => 'checkbox',
      '#title' => t('Curve'),
      '#description' => t('Use a curve function'),
      '#default_value' => $this->options['curve'],
    );   
    $form['3d'] = array(
      '#type' => 'checkbox',
      '#title' => t('3D'),
      '#description' => t('Make chart 3D'),
      '#default_value' => $this->options['3d'],
    );
    $form['colors'] = array(
      '#type' => 'textfield',
      '#title' => t('Colors'),
      '#description' => t('A color strings separated by commas. Ex. red, #004411'),
      '#size' => 32,
      '#default_value' => $this->options['colors'],
    );
    $form['max'] = array(
      '#type' => 'textfield',
      '#title' => t('Max'),
      '#description' => t('Gauge Graph max reading'),
      '#size' => 32,
      '#default_value' => $this->options['max'],
     );
     $form[redColor] = array(
     '#type' => 'textfield',
     '#title' => t('Red Color'),
     '#description' => t('Gauge: Red color shade'),
     '#size' => 32,
     '#default_value' => $this->options['redColor'],
     );
     $form[redFrom] = array(
     '#type' => 'textfield',
     '#title' => t('Red From'),
     '#description' => t('Gauge: Red from value'),
     '#size' => 32,
     '#default_value' => $this->options['redFrom'],
     );
     $form[redTo] = array(
     '#type' => 'textfield',
     '#title' => t('Red To'),
     '#description' => t('Gauge: Red to value'),
     '#size' => 32,
     '#default_value' => $this->options['redTo'],
     );
     $form[yellowColor] = array(
     '#type' => 'textfield',
     '#title' => t('Yellow Color'),
     '#description' => t('Gauge: Yellow color shade'),
     '#size' => 32,
     '#default_value' => $this->options['yellowColor'],
     );
     $form[yellowFrom] = array(
     '#type' => 'textfield',
     '#title' => t('Yellow From'),
     '#description' => t('Gauge: Yellow from value'),
     '#size' => 32,
     '#default_value' => $this->options['yellowFrom'],
     );
     $form[yellowTo] = array(
     '#type' => 'textfield',
     '#title' => t('Yellow To'),
     '#description' => t('Gauge: Yellow to value'),
     '#size' => 32,
     '#default_value' => $this->options['yellowTo'],
     );
     $form[greenColor] = array(
     '#type' => 'textfield',
     '#title' => t('Green Color'),
     '#description' => t('Gauge: Green color shade'),
     '#size' => 32,
     '#default_value' => $this->options['greenColor'],
     );
     $form[greenFrom] = array(
     '#type' => 'textfield',
     '#title' => t('Green From'),
     '#description' => t('Gauge: Green from value'),
     '#size' => 32,
     '#default_value' => $this->options['greenFrom'],
     );
     $form[greenTo] = array(
     '#type' => 'textfield',
     '#title' => t('Green To'),
     '#description' => t('Gauge: Green to value'),
     '#size' => 32,
     '#default_value' => $this->options['greenTo'],
     );
     $form[animation.duration] = array(
     '#type' => 'textfield',
     '#title' => t('Animation Duration'),
     '#description' => t('Gauge: Animation time in miliseconds ie: 400'),
     '#size' => 32,
     '#default_value' => $this->options['animation.duration'],
     );
     $form[animation.easing] = array(
     '#type' => 'textfield',
     '#title' => t('Animation Easing'),
     '#description' => t('Gauge-Animation Options are:<br>linear - Constant speed.<br>in - Ease in - Start slow and speed up.<br>out - Ease out - Start fast and slow down.<br>inAndOut - Ease in and out - Start slow, speed up, then slow down.'),
     '#size' => 32,
     '#default_value' => $this->options['animation.easing'],
     );
     
  }

  function render() {
    $header = array();
    $item = array();
    // Special treat to OrgChart.
    if ($this->options['type'] == 'OrgChart') {
      foreach ($this->render_fields($this->view->result) as $row_index => $row) {
        foreach ($row as $key => $field) {
          if (!$this->view->field[$key]->options['exclude']) {
            $item[$row_index][] = $field;
          }
        }
      } 
    }
    // Default chart treat.
    else {
      foreach ($this->view->field as $key => $field) {
        if ($field->position !== 0) {
          $column[] = !empty($field->options['label']) ? $field->options['label'] : $field->definition['title'];
        }
      }

      foreach ($this->render_fields($this->view->result) as $row_index => $row) {
        foreach ($row as $key => $field) {
          if (!$this->view->field[$key]->options['exclude']) {
            if ($this->view->field[$key]->position === 0) {
              $header[$row_index] = $field;
            }
            else {
              $item[$row_index][] = $field;
            }
          }
        }
      }

      $item = _flip($item);
    }

    // Account for grouping field being set.
    if (isset($this->options['grouping'][0])) {
      _google_chart_tools_apply_grouping_conversion($header, $item);
    }


    $settings['chart'][drupal_clean_css_identifier($this->view->name . '-' . $this->display->id)] = array(  
      'header' => !empty($header) ? $header : '',
      'rows' => $item,
      'columns' => !empty($column) ? $column : '',
      'chartType' => $this->options['type'],
      'options' => array(
        'forceIFrame' => FALSE,
        'curveType' => $this->options['curve'] ? "function" : "none",
        'is3D' => $this->options['3d'],
        'colors' => $this->options['colors'] ? explode(",", str_replace(' ', '', $this->options['colors'])) : NULL,  
        'title' => $this->options['title'],
        'width' => $this->options['width'],
        'height' => $this->options['height'],
        'max'=> $this->options['max'],
        'redColor' => $this->options['redColor'],
        'redFrom' => $this->options['redFrom'],
        'redTo' => $this->options['redTo'],
        'yellowColor' => $this->options['yellowColor'],
        'yellowFrom' => $this->options['yellowFrom'],
        'yellowTo' => $this->options['yellowTo'],
        'greenColor' => $this->options['greenColor'],
        'greenFrom' => $this->options['greenFrom'],
        'greenTo' => $this->options['greenTo'],
        'animation.duration' => $this->options['animation.duration'],
        'animation.easing' => $this->options['animation.easing'],
        'allowHtml' => TRUE
      )   
    );

    if (strpos($_GET['q'], 'admin/structure/views/nojs/preview') === FALSE) {
       //Draw it.
      $ret = draw_chart($settings);
      return $ret['markup'];
    }
  }
}

function _flip($arr) {
  $out = array();
  foreach ($arr as $key => $subarr) {
    foreach ($subarr as $subkey => $subvalue) {
      $out[$subkey][$key] = $subvalue;
    }
  }
  return $out;
}

/**
 * SUM datasets based on grouping value.
 */
function _google_chart_tools_apply_grouping_conversion(&$header, &$item) {
  // establish overlap by header name
  $tmp_header = array_flip($header);
  foreach ($header as $value) {
    $tmp_header[$value] = array();
  }
  // populate tmp_header with the array key matches of header
  foreach ($header as $key => $value) {
    $tmp_header[$value][] = $key;
  }
  $tmp_item = array();
  // SUM the items into their respective totals
  foreach ($item as $item_key => $datapoints) {
    $tmp_item[$item_key] = array();
    foreach ($tmp_header as $header_key => $header_array) {
      $tmp_item[$item_key][$header_key] = NULL;
      foreach ($header_array as $datapointkey) {
        $tmp_item[$item_key][$header_key] += $item[$item_key][$datapointkey];
      }
    }
  }
  // reset the header so we can merge it
  $header = array();
  foreach ($tmp_header as $header_key => $header_array) {
    // quotes ensure that header_key will be a string
    $header[] = "$header_key";
  }
  // convert the name aggregates back to generic keys
  foreach ($tmp_item as $item_key => $datapoints) {
    $tmp_item[$item_key] = array_values($datapoints);
  }
  // set item to the new datapoints array
  $item = $tmp_item;
}

Seems to be working like a charm...