
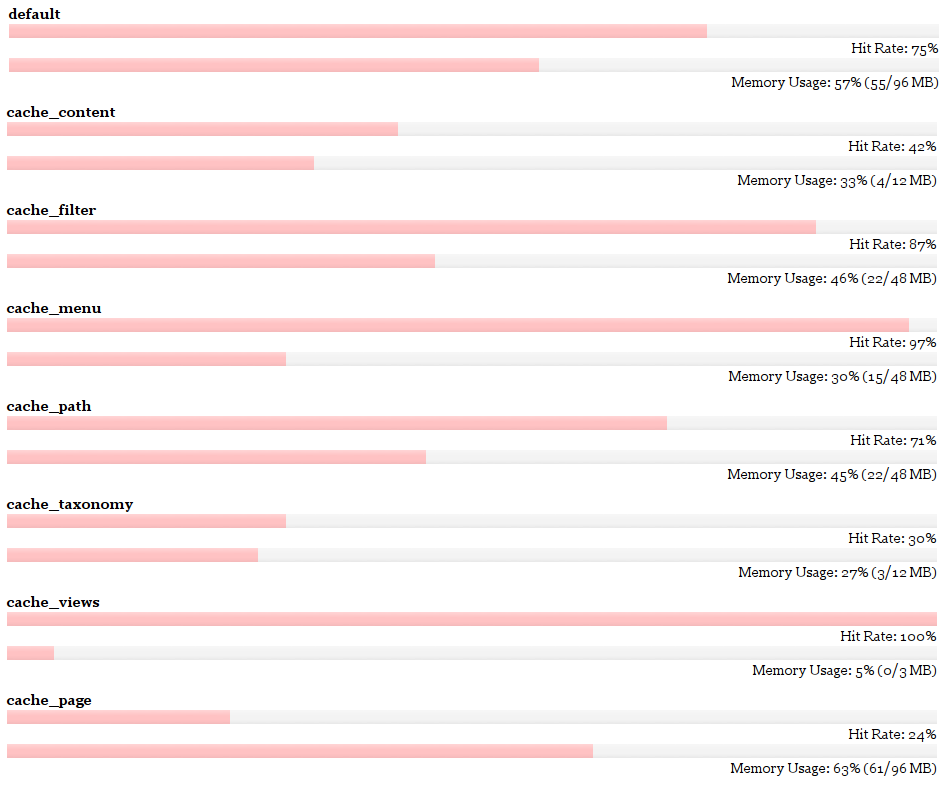
This patch adds graphs for hit rate and usage for each bin as the default page in admin/logs/memcache using poll module's markup and css. Also, attached is a little cli script that I've been using to tweak my memcached instance sizes that lead to this patch.
Both display aggregate stats per bin, so if a bin is spread across a cluster it will calculate hit rate and usage as the sum of the bins on each server. This makes it easier to get a general overview for what's going on.
| Comment | File | Size | Author |
|---|---|---|---|
| #12 | errors.txt | 9.15 KB | catch |
| #9 | memcache_stats.png | 60.92 KB | Jeremy |
| #9 | memcache_stats.patch | 15.37 KB | Jeremy |
| #8 | memcache_stats.png | 38.55 KB | Jeremy |
| #8 | memcache_admin.module.patch.txt | 4.92 KB | Jeremy |


Comments
Comment #1
tomchuk CreditAttribution: tomchuk commentedAck, attachments disappeared.
Comment #2
tomchuk CreditAttribution: tomchuk commentedComment #3
robertDouglass CreditAttribution: robertDouglass commentedThere is also a memcache stats file somewhere on the internet (from one of the PECL maintainers) that basically replicates the admin screen from the APC package. The graphs in that file are beautiful, and there is extensive click-through reporting for all bins and servers, as well as the ability to selectively clear items. I think we should find that, resolve any potential licensing issues, and use it. These proposed graphs are very nice, but the ones I saw are a whole different world.
Comment #4
svenb CreditAttribution: svenb commentedHere's what you've been searching for:
http://livebookmark.net/journal/2008/05/21/memcachephp-stats-like-apcphp/
Comment #5
Jeremy CreditAttribution: Jeremy commentedMarking as patch needs work -- the idea is very much a step in the right direction, but let's take this even further...
Comment #6
kbahey CreditAttribution: kbahey commentedHarun Yayli is the author of this graph tool. It is very similar to APC's tool.
Here is the direct download link http://livebookmark.net/memcachephp/memcachephp.zip
The latest stable PECL memcache version http://pecl.php.net/package/memcache/2.2.4 says that it is included in the release.
Comment #7
catchMoving to 7.x, apc.php-like stats would be great.
Comment #8
Jeremy CreditAttribution: Jeremy commentedMoving back to 6.x-1.x for a current project. To begin I'm simply pulling together more useful stats:

From here I plan to display stats from all servers on the same page (to allow a quick comparison / quickly spot servers that are mis-configured or having issues), and finally the goal will be to pretty-format it all with graphs ala apc.
This is a work in progress and nothing has been committed yet, but feedback on the stats presented in the above screen shot are very welcome.
Comment #9
Jeremy CreditAttribution: Jeremy commentedThe attached patch completes phase 2 of this effort, which is to pull all relevant information together onto a single page to allow a quick analysis of the performance of all your memcache servers. There seems to be an issue preventing switching between bins, but otherwise it's working as designed. It currently only shows the default statistics page, none of the other statistics ('malloc', 'maps', 'slabs', 'items', and 'sizes').
From here it would be nice to pretty-format things in an apc.php style, but I'd like to commit this as is first as a step forward if there's no resistance. Feedback?
Comment #10
catchI really like how this is going, having everything on one page is useful for comparisons, I hate having to compare anything between tabs.
It looks like a lot of code could be removed from memcache_admin_menu(), but I don't see any hunks in that patch. Or is the intention to leave those pages in for now?
Comment #11
Jeremy CreditAttribution: Jeremy commented> It looks like a lot of code could be removed from
>memcache_admin_menu(), but I don't see any hunks
> in that patch. Or is the intention to leave those pages
> in for now?
I've not yet done that cleanup, as it seems it may prove handy to be able to drill down more into each individual server in addition to seeing this overview. That way no stats are lost, but the main stats are more useful and organized.
Comment #12
catchWhen hit the stats page, I got a lot of notices (attached), didn't look into them yet.
Also I saw slightly odd statistics when I first got there.
25 gets (36.76%), 25 hits (100.00%) 53 misses (212.00%)
this then changed to
61 gets (56.48%), 61 hits (100.00%) 65 misses (106.56%)
And a couple of clicks later the last number went under 100%.
Leaving the full pages sounds sensible to me. I was thinking about #961472: Memcache stats reporting page menu items only reflect state at which menu router was rebuilt - if we were to make the server ips links, they could go straight to a menu callback with the server as argument, that'd save using tabs and would get rid of that issue (there's another one about the default tab too).
Overall this looks great and I agree about committing it soon and revisiting to add nice graphs, it's already a big improvement on what's there.
Comment #13
catchJust realised that the per-page average should be per-connection average due to #822316: receiving a PHP notice "Connection reset by peer .... dmemcache.inc on line 104" - currently some servers are opened with a persistent connection, with that patch this will be optional.
Comment #14
Jeremy CreditAttribution: Jeremy commentedThanks for the feedback, Nat. I addressed the wording to per-connection and improper get stats, and cleaned up all the errors I could duplicate -- I only saw a fraction of the errors you reported with E_ALL however, so please let me know if this is still a problem for you that I'm somehow masking with my installation.
This has been tested with both the memcache and memcached PECL extensions (the latter provides fewer statistics), with custom configurations defined in settings.php, default configurations (no memcache_bins or memcache_servers defined in settings.php), with a broken configuration (a dead memcache instance -- the memcached PECL extension doesn't handle this well), with multiple servers per bin and single servers per bin, and all combinations of these configurations.
I have committed this code as a step forward to eliminating general confusion people have when reviewing memcache statistics. It adds a detailed overview page (per the screenshots above) while still retaining per-server raw statistics (missing in earlier patches). I also added the ability to dump individual slab caches, inspecting the actual cache-keys contained in memcache -- a future followup could allow us to fully dump the individual cache-keys to see their contents, though I'm not sure how we'd best display this data as it may be binary compressed data. I wrapped the slab-cache dumping in a new permission as visiting this page locks up the memcache server while the slab contents are being dumped: I'm open to ideas on how to best communicate this to memcache_admin users so folks don't cause themselves problems.
Committed here:
http://drupalcode.org/project/memcache.git/commitdiff/336ab52
I think the next step is porting this to the 7.x-1.x-dev branch. Once done, then we can revisit adding pretty-graphs beyond these informative tables.
Comment #15
Jeremy CreditAttribution: Jeremy commentedWhile testing #1134158: Test 'upgrade path' from 6.x-1.8 to 6.x-1.9 I found that the items statistics weren't displaying correctly. I fixed this, and added a link from the items display to individual slab cachedumps.
http://drupalcode.org/project/memcache.git/commitdiff/015ac68
Comment #16
Jeremy CreditAttribution: Jeremy commentedCommitted some E_ALL cleanup, and added hits and gets per second stats.
http://drupalcode.org/project/memcache.git/commitdiff/4d34dde
Comment #17
catchBumping to critical, would be good to get this in before 7.x-1.0
Comment #18
Jeremy CreditAttribution: Jeremy commentedMaking a stab at this now... assigning to myself.
Comment #19
Jeremy CreditAttribution: Jeremy commentedCommitted:
http://drupalcode.org/project/memcache.git/commit/63bc6f2