
Description
jQuery Map Hilight is a javascript wrapper module for the jquery Map Hilight plugin by David Lynch (like the director, but not). It enables the simple addition of mouseover highlighting of hotspots to HTML image maps without requiring the editing of theme files or knowledge of javascript/jquery.
Features
- provides simple interactive graphics via HTML image maps (no flash required).
- easy to use: either select the 'highlight all image maps' default setting or simply add class="jq_maphilight" to the <img> tag of any specific image map you wish to highlight.
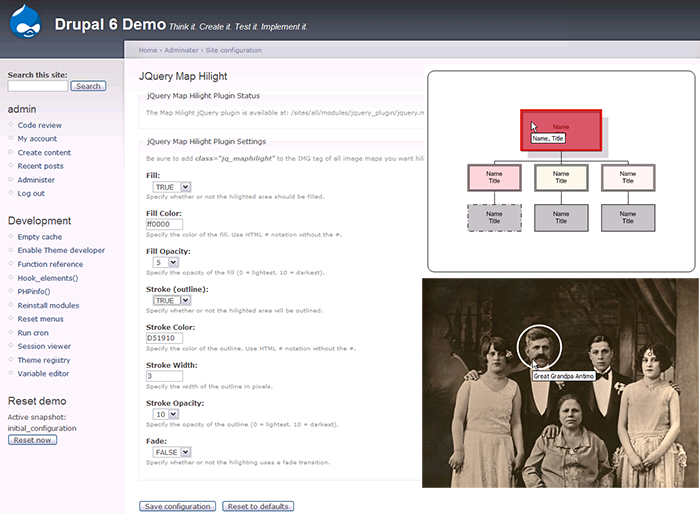
- no jquery or javascript knowledge required: plugin configuration is handled via an admin/settings screen rather than having to enter jquery code.
- fully configurable: options for fill, fill color, fill opacity, outline, outline color, outline opacity, outline thickness, as well as a fade effect.
- per image map settings: add image map specific options with an additional class.
Examples
Image Maps
Sometimes all you need is an image that has some tooltips and hotspots that link to other pages. Flash is way overkill for such a simple thing-- enter (x)HTML Image Maps. Simply defined, an image map is an image that has hotspots. These hotspots can either be hyperlinks or not. Sometimes just highlighting an area and providing a tooltip is all thats needed (for example, a map of the united states may just pop-up a tooltip with facts about the state and not actually require a hyperlink).
The image map tags themselves are actually very simple. An image map consists of three parts-- the IMG tag (a "usemap" attribute is added to a standard IMG tag), the MAP tag (connects the MAP and a group of hotspots to the IMG), and the AREA tags (define the actual hotspots):
<img src="/sites/default/files/images/sample.png" usemap="#imagemap" border="0" />
<map name="imagemap">
<area href="http://www.whatever.com" shape="RECT" coords="168,71,312,143" title="This is the tooltip." />
<area href="http://www.whatever.com" shape="CIRCLE" coords="132,138,37" title="This is the tooltip." />
<area href="http://www.whatever.com" shape="POLYGON" coords="277,17,326,104,234,110" title="This is the tooltip." />
</map>
The only somewhat difficult part of creating an image map is specifying the coordinates for the hotspots. However, the good news is, there are a couple of ways to do this very easily. Probably the easiest way is to use an online image map creator such as HTML-Image map Creator WYSIWYG - uses AJAX or Online Image Map Editor. Another option is to use a freeware image map program like Handy Image Mapper (scroll about 1/2 down the page for the download link). And finally, there is the long standing commercial MapEdit program (versions available for windows, mac, & linux) for the very reasonable price of $US 15. [DISCLAIMER: I have no connection with any of these products except to have used them all at one time or another.]
Recently I discovered a plugin for both tinymce and fckeditor to ease the creation of image maps while editing. I haven't tried the tinymce one yet, but the FCKeditor one is very slick.
If you use MS Visio for flowcharts/diagrams, saving your file with the "Save as Web Page" option actually creates a file with the a complete image map. In the folder created as part of the process, will be several png_*.htm files (one for each page). In those files will be the complete image map (search for <MAP NAME="visImageMap"> ) for that particular page of the diagram. There's some extra attributes you may wish to strip out, but the complete coordinates for all the hotspots are there-- a huge time saver.
The one drawback of image maps has always been that the hotspots were only indicated with the change in cursor and appearance of a tooltip (if specified). Not very user friendly. Previously, this defect was addressed by writing complicated scripts to swap out the entire image with separately created images highlighting the various hotspots. There were a number of downsides to this approach-- the overhead of swapping out images was noticeable, configuring the highlights were impossible (each image had to be manually created), scripting the swap was complicated. The jquery Map Hilight plugin fixes all this by adding fully configurable mouseover highlighting to the hotspots on a per image map basis and this module brings that functionality to Drupal via an easy to use form based interface to the plugin.
With the invention of the Map Hilight plugin, image maps finally become an amazingly easy way of adding simple, interactive graphics to a website without the overhead and complexity of flash or having to know javascript.
Prerequisites
- D6: jquery_plugin module
- D7: libraries module
- Both: jquery Map Hilight plugin
Included with the distribution are a test image and sample html to verify functionality and get you started.
Project information
 Maintenance fixes only
Considered feature-complete by its maintainers.- Module categories: Developer Tools
 494 sites report using this module
- Created by WorldFallz on , updated
 Stable releases for this project are covered by the security advisory policy.
Look for the shield icon below.


