
This module provides an API and views integration for using the flot graphing library. It is designed to make it simple to add flot graphs or charts, it supports line, bar and pie charts.
More information about flot is available here http://code.google.com/p/flot/
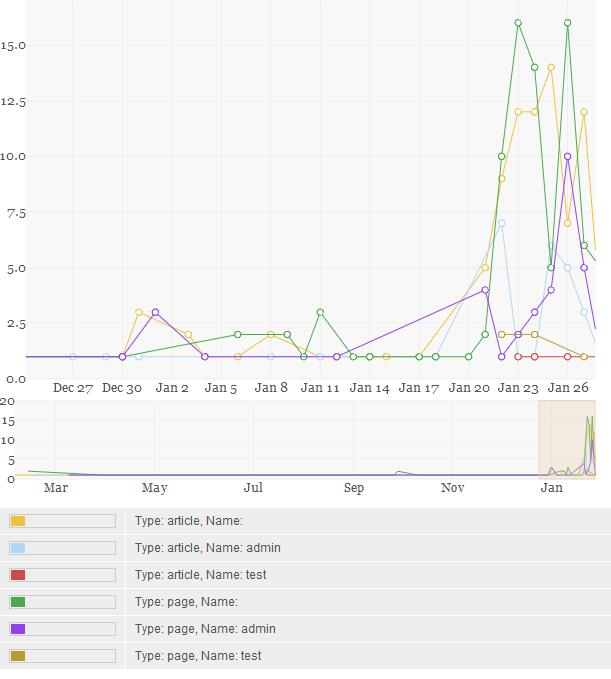
Here is a flot usage example: http://drupal.org/node/386484
Warnings
- You have to download the flot library from http://code.google.com/p/flot/, use version 0.7 for Drupal 7
- Graphs don't show in views preview mode in the Drupal 7 version
Drupal 7
Drupal 7 is available, the module is split into submodules:
- Flot: the main module containing the API and theme function
- Flot views: the integration with views (dependency: http://drupal.org/project/views_decorator) and there's also a new views style plugin to create flot graphs, Flot fields. This is the prefered one.
Demo for Drupal 7
The Flot module can be tested on simplytest.me. Make sure you click the advanced menu and install the "Libraries API" as well as Flot. After the site is installed, enable the flot modules and all dependencies. If you visit the front page, links to examples will be on the main menu.
Flot fields
Flot fields is the new views plugin to create flot chart and it uses the aggregation functions from views, easiest way to setup your views it to start adding your fields: stat with the X-axis field and add 1 or more fields for the Y-axis, don't forget to add the fields for the labels. If you want to display the count by content type, you have to add the node-type field twice, once for the count and a second time for the label. Once you added all your fields turn on "Use aggregation" hidden beneath the advanced settings, edit the Y-axis fields again and select count, sum, ...
If your X-axis field is a datetime field and if you have an exposed filter on this field with the between operator, you can zoom in on your graph with refreshing.
This project contains several modules. The FLOT module allows module developers to add charts and graphs to their modules by way of a custom render element. The FLOT_examples module is an assortment of examples of how to produce a variety of charts. Lastly, one of the examples requires an additional external library. This library is packaged into a separate module to demonstrate how FLOT's features can be extended.
The Drupal 7 branch is currently unsupported. If you would like to maintain the D7 branch, please let Beakerboy know.
Drupal 8
The Flot object contains series data, and chart options. The module's element scans these to determine which javascript libraries to include. The plot can be rendered using an included bare-bones template, or the developer can create their own for more complex logic and layouts. The flot_examples module demonstrates basic and more advanced techniques.
Using the Module
Developers can use this module in either of two ways, using the default render element, or creating a new render element.
Default Render Element
The default render element can be called from within a controller the following parameters:
$output[] =[
      // Required.
      '#type' => 'flot',
      // Optional. The custom_theme_name is your set of Twig templates, js, and css files.
      '#theme' => 'custom_theme_name',
      // Required. An array of data. See the FLOT API and examples for the format.
      '#data' => [],
      // Optional. An array of plot options. See the FLOT API and examples for the format.
      '#options' => [],
      // Optional. The id of the div element. The default value is 'placeholder'
      '#id' => 'placeholder',
      // Optional. Set to TRUE if you would like the plot to be able to be resized on the fly by the user.
      '#resizable' => FALSE,
]
Custom Render Element
If a developer would like to create a custom plot layout which will be used in several contexts, they can create their own custom render element by extending the Flot class. The "Visitors" page in the flot_examples module provides a working example of this.
namespace Drupal\[module_name]\Element;
use Drupal\Core\Render\Element\RenderElement;
use Drupal\flot\Element\Flot;

/**
 * Provides a flot render element.
 *
 * @RenderElement("[element_type]")
 */
class FlotNew extends Flot {
  public function getInfo() {
    $output = parent::getInfo();
    // Add entries to $output to extend the object
    //$output['#something'] = some_default_value;
    return $output;
  }

  public static function preRenderPlot($element) {
    // Insert code to modify the data and options before libraries are checked.
    $element = parent::preRenderPlot($element);
    //Add additional code after libraries are checked.

    return $element;
  }
}
Non-developers can use the two Views Formatters to display a view as a pie chart, or a time-series chart with points and/or lines. There are examples of each of these as example modules.
Views Formatters
The Drupal 8 module also contains two views formatters. These can be used to render views as a pie chart, bar chart, or time-series line or scatter plot without the need to type a single line of code.
Plugins
Flot has been extended by many developers through the creation of other plugins. These plugins can be easily enabled by creating a simple wrapper around the existing JavaScript code and creating a new Element. The flot_spider module demonstrates this process.
Project information
 512 sites report using this module
- Created by jmiccolis on , updated
 Stable releases for this project are covered by the security advisory policy.
Look for the shield icon below.
Releases
7.x-1.3
released 11 January 2019
Works with Drupal: 7.x
✓ Recommended by the project’s maintainer.
Development version: 7.x-1.x-dev updated 12 Jan 2019 at 17:08 UTC


